🌍 Public
Fork of D3 selection exploration
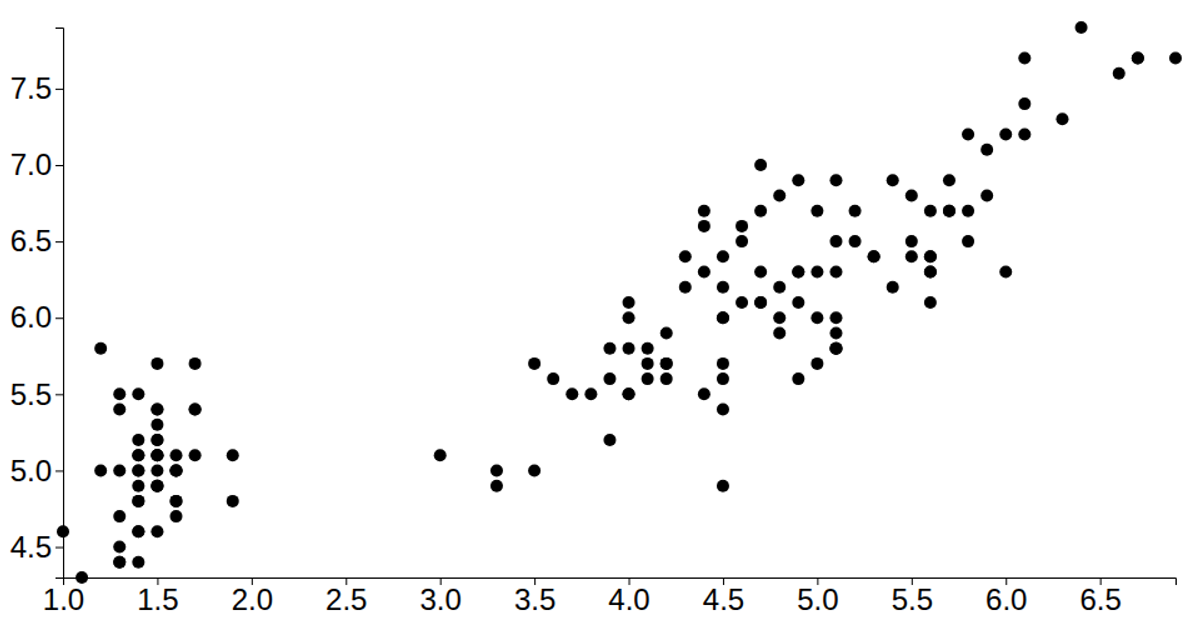
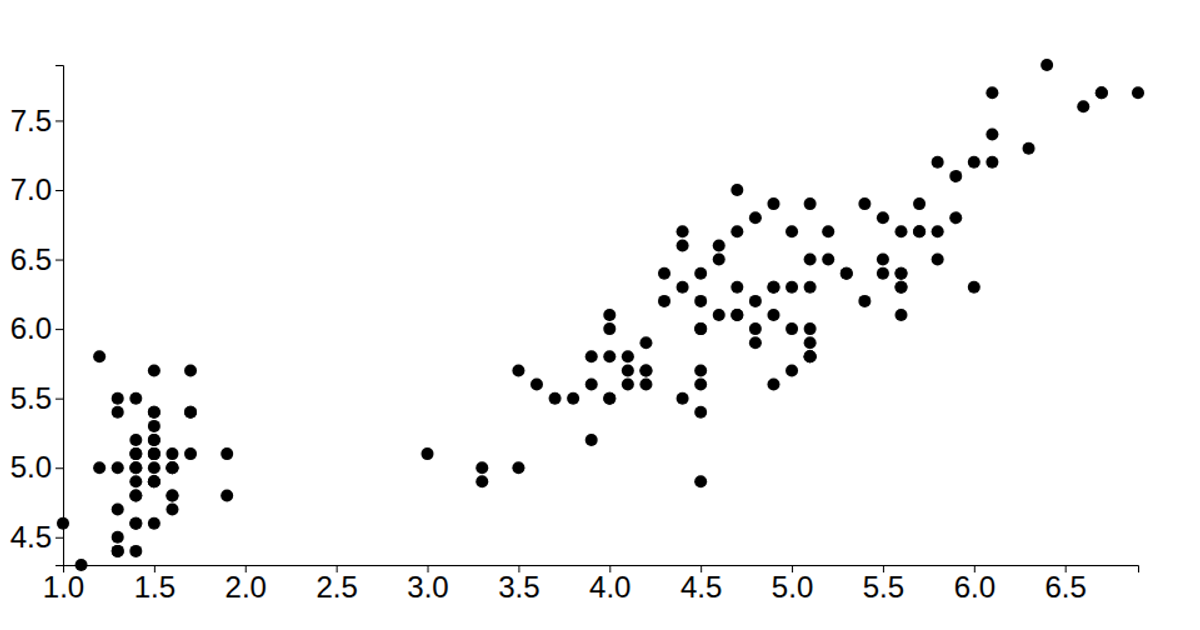
This example demonstrates a simple scatter plot of the Iris dataset, mapping petal length and width to x and y positions. It creates a responsive SVG chart using D3 v7, with scales and axes configured via `scaleLinear`, `axisLeft`, and `axisBottom`. Data is loaded as CSV and parsed, then circles are joined to the SVG using `selectAll` and `data`. The plot fills the browser window, with margins applied to the axes.
AI-generated descriptionA demonstration of how to start using D3 version 6.
MIT Licensed


Comments
Sign in to join the discussion.