🌍 Public
Title
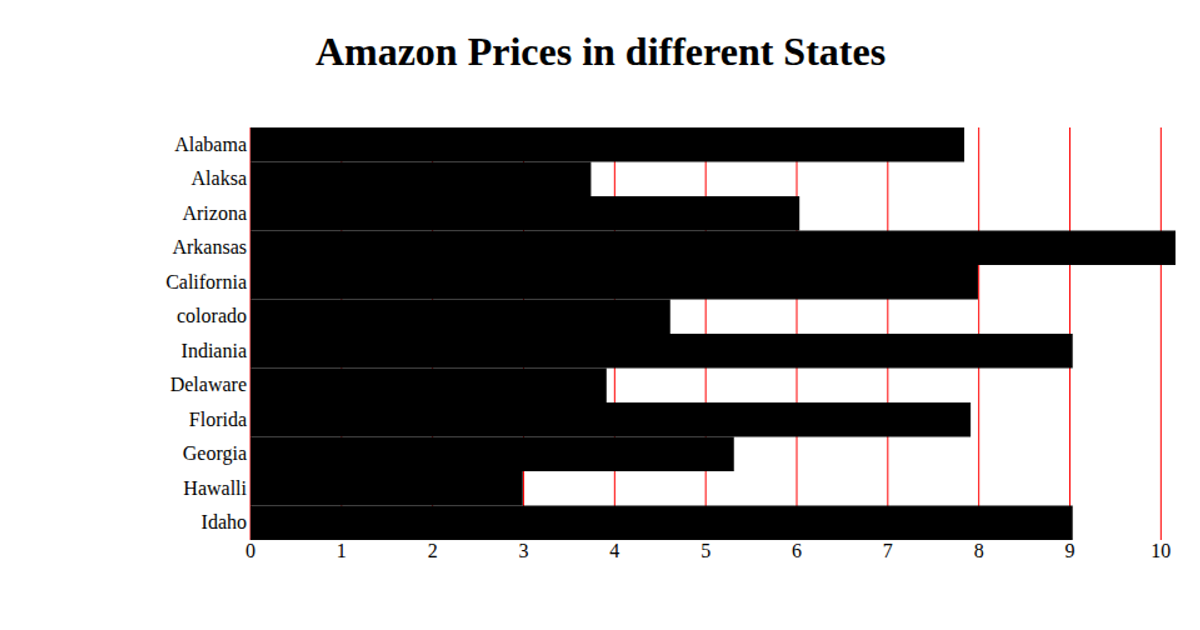
This visualization shows the monthly cost of starter plans across twelve different zones, displayed as horizontal bars on an SVG chart. The chart uses D3.js scales for both the x-axis (linear scale for cost values) and y-axis (band scale for zone categories). Data is loaded from a CSV file using D3’s `csv` function, with the value field parsed as a number. React manages the component state and rendering, while D3 handles the axis ticks, grid lines, and bar rectangles.
AI-generated descriptionA bare minimum HTML page demonstrating use of CSS and JavaScript.
See also React Starter.
MIT Licensed




Comments
Sign in to join the discussion.