🌍 Public
ice6_part1
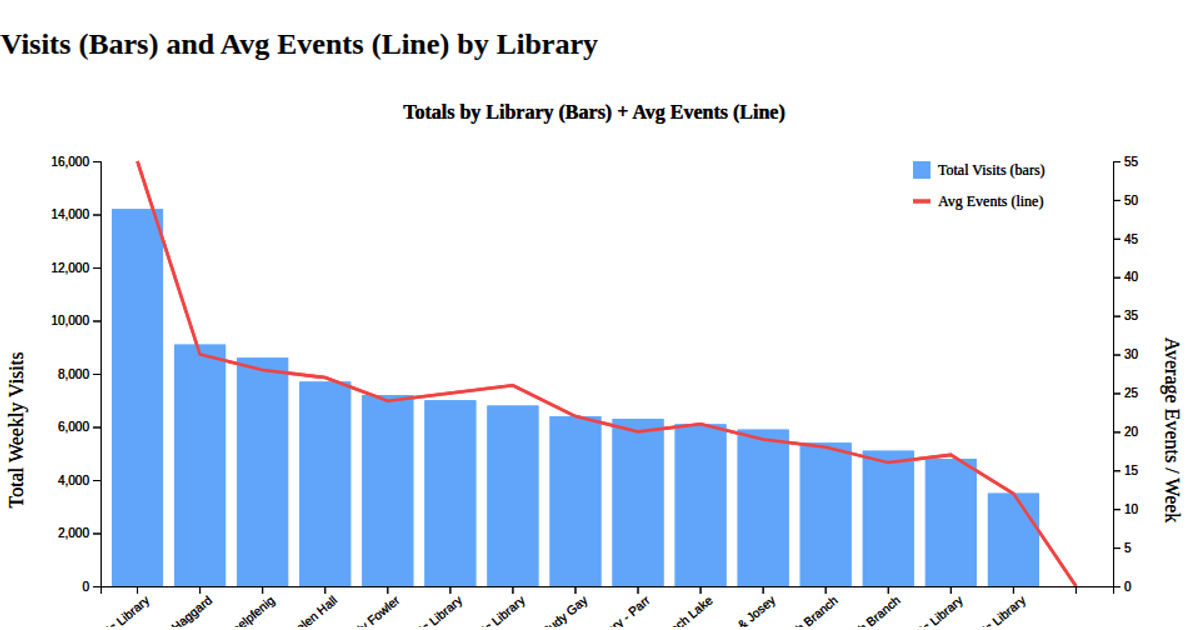
A bar chart shows total weekly visits per public library from a DFW libraries dataset, with libraries sorted in descending order and bars colored red. The code uses D3 v7’s `d3.text`, `d3.csvParse`, and `d3.rollup` to load and aggregate the CSV data, then renders an SVG chart with `d3.scaleBand`, `d3.scaleLinear`, `d3.axisBottom`, and `d3.axisLeft`. Data is sourced from a GitHub gist containing the 2025 weekly visits CSV.
AI-generated descriptionMIT Licensed



Comments
Sign in to join the discussion.