🌍 Public
Coronavirus Death in the World
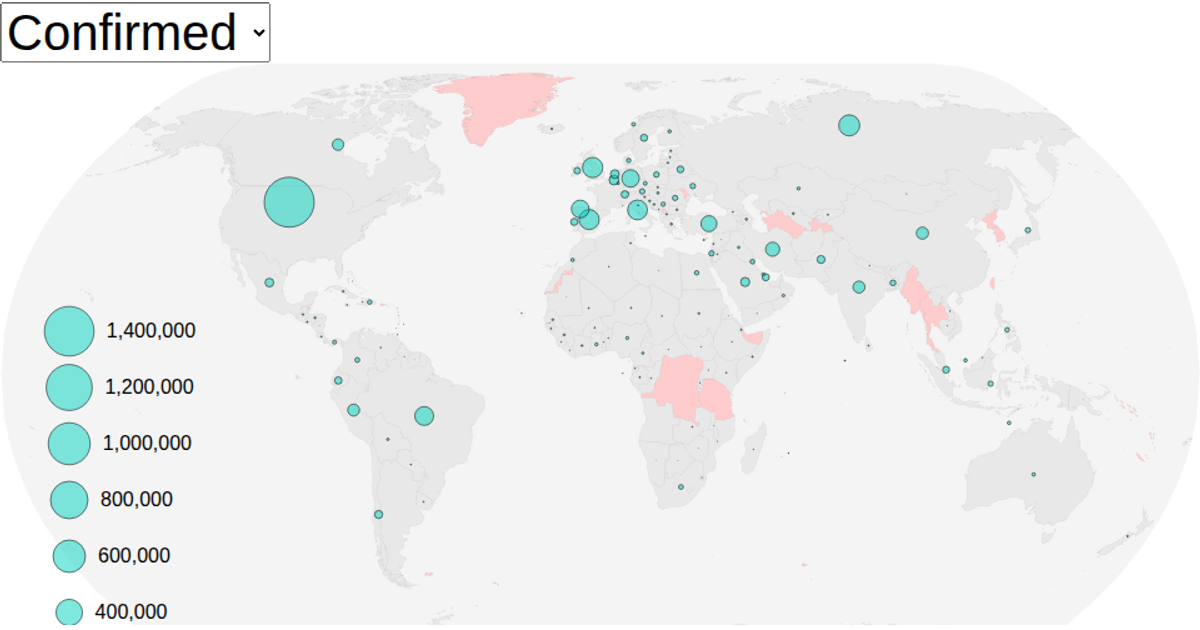
A world map displays coronavirus deaths by city, with red circles sized proportionally to reported fatalities. The visualization uses a natural Earth projection via `geoNaturalEarth1` and `geoPath` to render landmasses, graticules, and country boundaries. City data comes from a CSV file loaded with `d3.csv`, while country shapes use TopoJSON from World Atlas. Circle radii are scaled with `scaleSqrt`, and the React component structure manages rendering through SVG elements.
AI-generated descriptionA world map showing cities with population greater than 50,000. City data from Simplemaps: World Cities Database.
Country boundaries from World Atlas TopoJSON, polished for visual style, including graticules.
MIT Licensed





Comments
Sign in to join the discussion.