🌍 Public
Line Chart
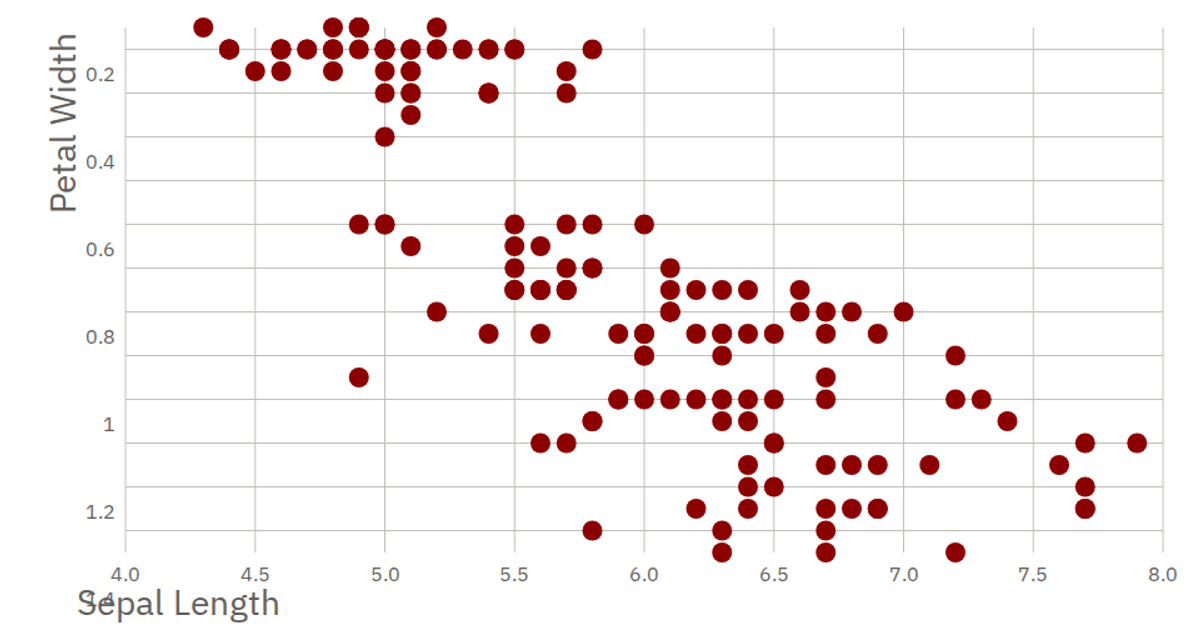
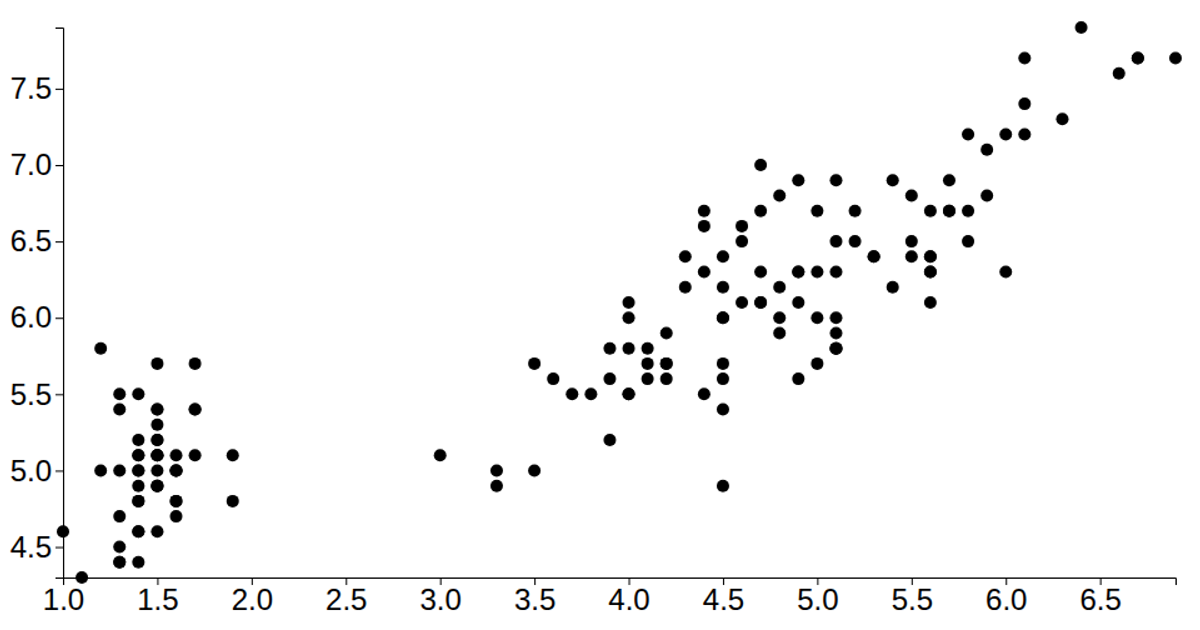
This line chart visualizes the relationship between sepal length and petal width, with sepal length on the x-axis and petal width on the y-axis. The chart uses D3 v6 with SVG rendering, loading data from a CSV file via `d3.csv`. It employs `d3.scaleLinear` for both axes, `d3.line` to generate the path, and `d3.axisBottom` and `d3.axisLeft` to display the axes. Axis labels are added as SVG text elements.
AI-generated descriptionMIT Licensed





Comments
Sign in to join the discussion.