🌍 Public
Fork of ICE-6 Scatter Plot-Prathyusha
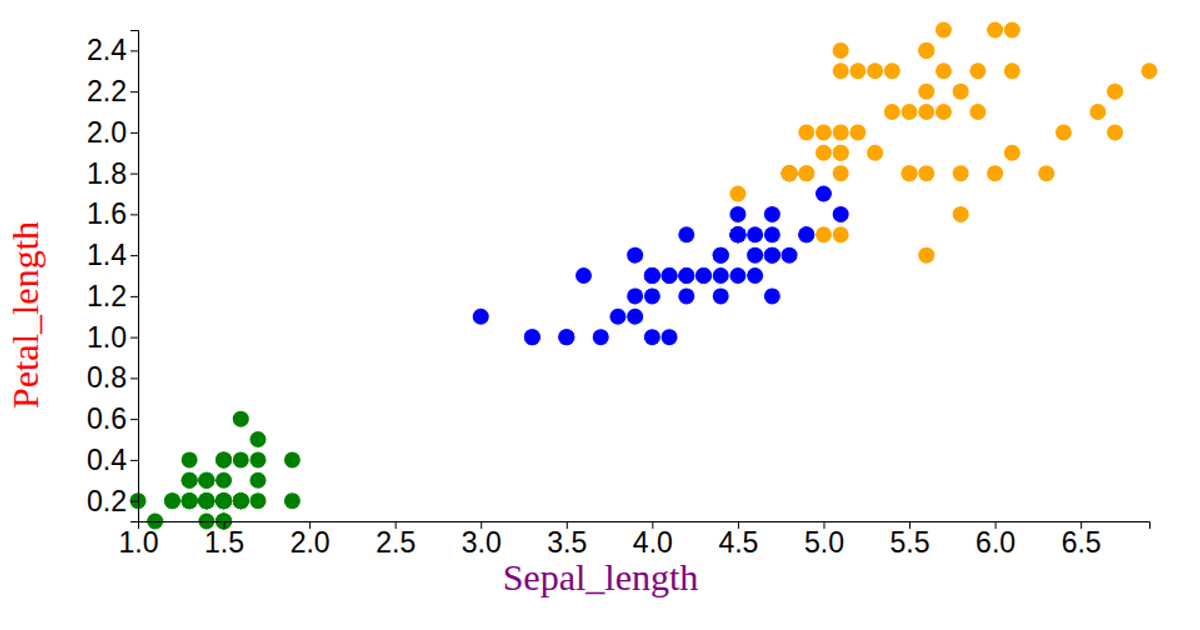
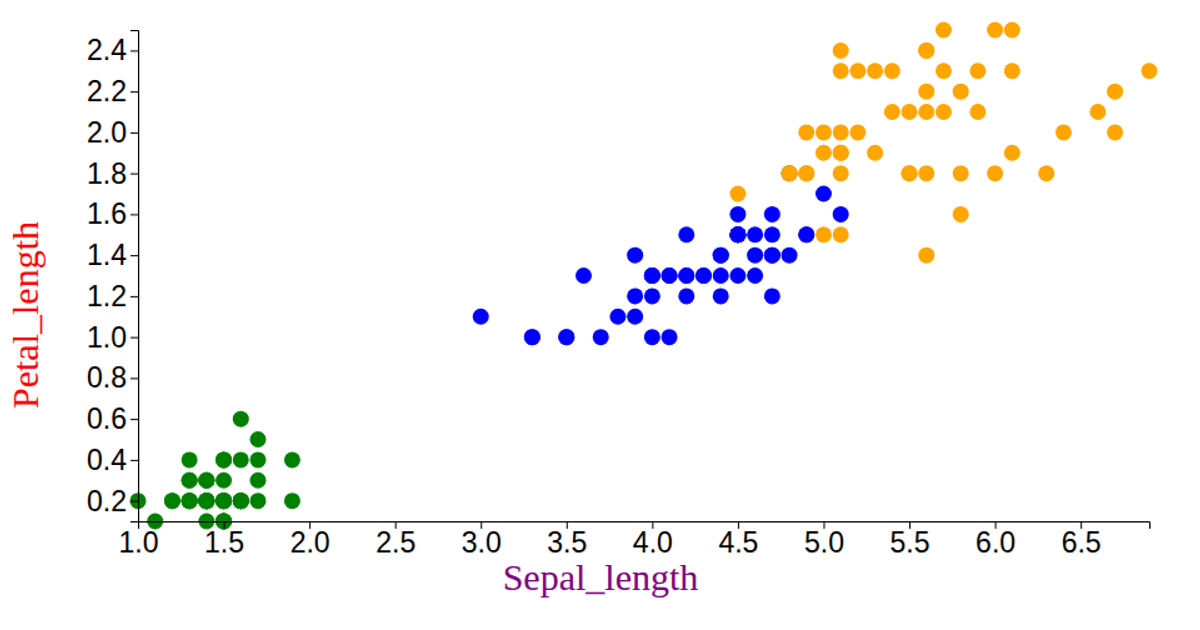
This visualization displays the Iris dataset as a scatter plot, mapping petal length and width to the x- and y-axes while encoding species with distinct colors (violet, yellow, and brown). It loads data from a CSV file using `d3.csv`, scales the coordinates with `scaleLinear` and `extent`, and renders circles as SVG elements via `selectAll` and `join`. The code also draws axes using `axisLeft` and `axisBottom`, with custom tick sizing and labeled axes for the petal and sepal measurements.
AI-generated descriptionMIT Licensed




Comments
Sign in to join the discussion.