🌍 Public
CyberAttacks Combined Vizs- Final Project Draft v3
Ccoreyfnolan@gmail.com
Last edited Apr 16, 2024
Created on Apr 16, 2024
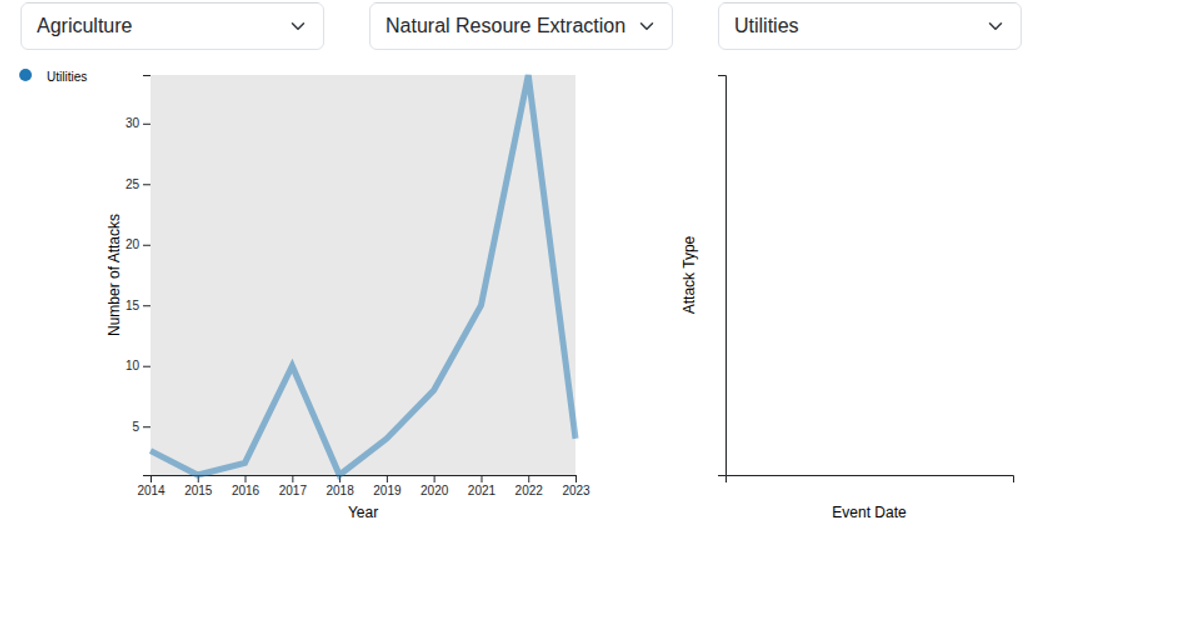
This gallery example combines a line chart, scatter plot, and interactive color legend to visualize cyberattack data. The line chart displays trends with a color legend; hovering a legend item filters the scatter plot to show data points for that industry. Users can also brush-select points in the scatter plot. The visualization uses D3.js, with the `observeResize` library handling responsive layouts, and data sourced from the `full_cyber_attack_data` package.
AI-generated descriptionA way of adding multiple visualizations to a single page.
MIT Licensed



Comments
Sign in to join the discussion.