🌍 Public
Grouped Scatter Plot (Column Layout)
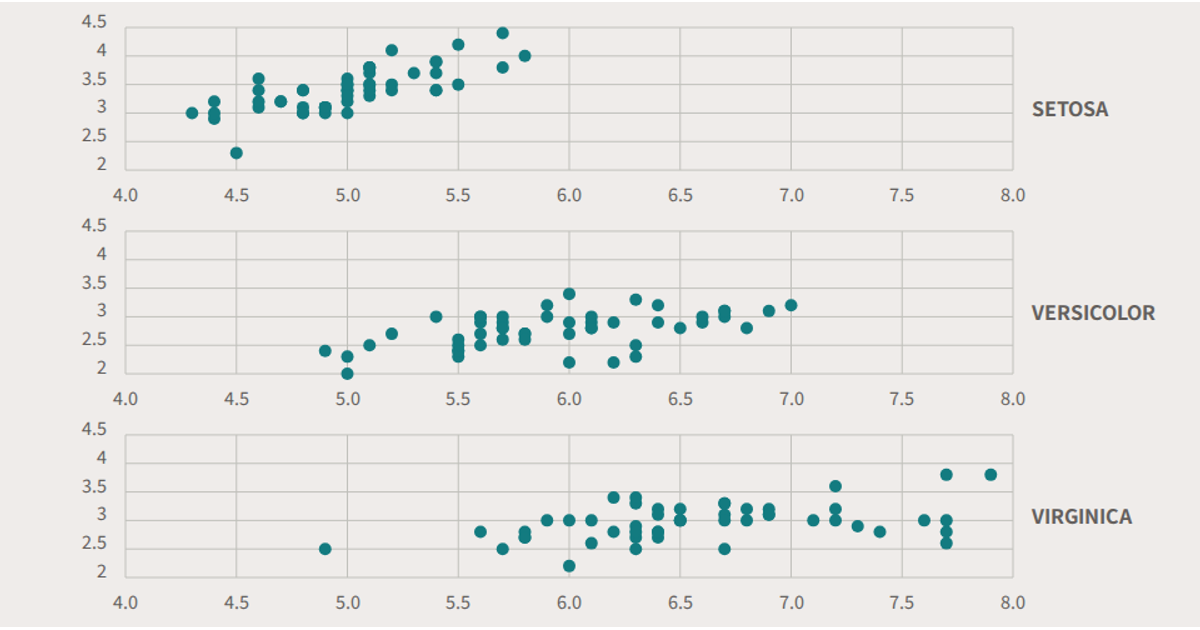
This grouped scatter plot displays the relationship between sepal width and sepal length for Iris flowers, split into three panels by species. Each panel shares the same y-axis scale but uses a separate x-scale constrained to its column width. The visualization uses React to render SVG elements, with D3’s `scaleBand` and `scaleLinear` for positioning, and loads data from a CSV via `d3.csv`. Axes are drawn manually as SVG lines and text elements, with a title above each column.
AI-generated descriptionSepal width (Y) vs. sepal length (X) of Iris flowers, grouped by species.
MIT Licensed




Comments
Sign in to join the discussion.