🌍 Public
React Starter
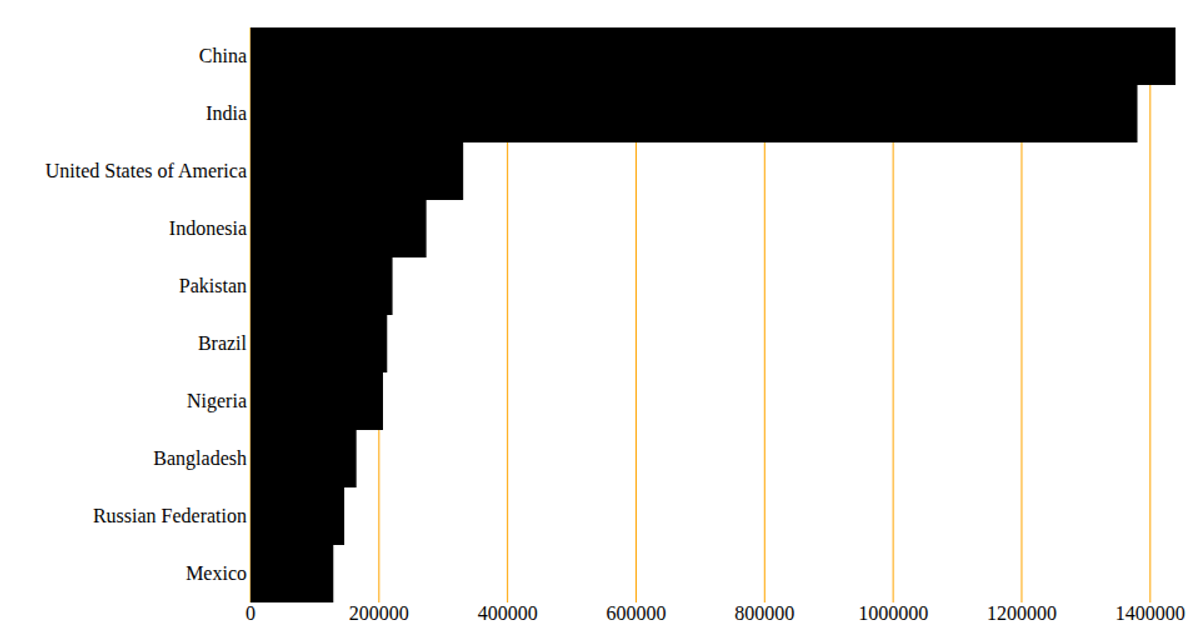
This horizontal bar chart displays the 2018 population estimates for the ten most populous countries, with values converted from thousands to raw numbers. The SVG visualization uses `d3.csv` to load the data, `d3.scaleLinear` for the x-axis, and `d3.scaleBand` with padding for the categorical y-axis. Population labels are formatted using `d3.format` to abbreviate large numbers, while axes are generated with `d3.axisLeft` and `d3.axisBottom`. The React starter project imports specific D3 v5 functions and appends rectangles directly to the SVG, styled with steelblue fills.
AI-generated descriptionThis bar chart shows population of the top 10 most populous countries. The data comes from the year 2018 estimate in United Naions: World Population Prospects 2017.
MIT Licensed



Comments
Sign in to join the discussion.