🌍 Public
ICE-8 2A Rithvik Reddy
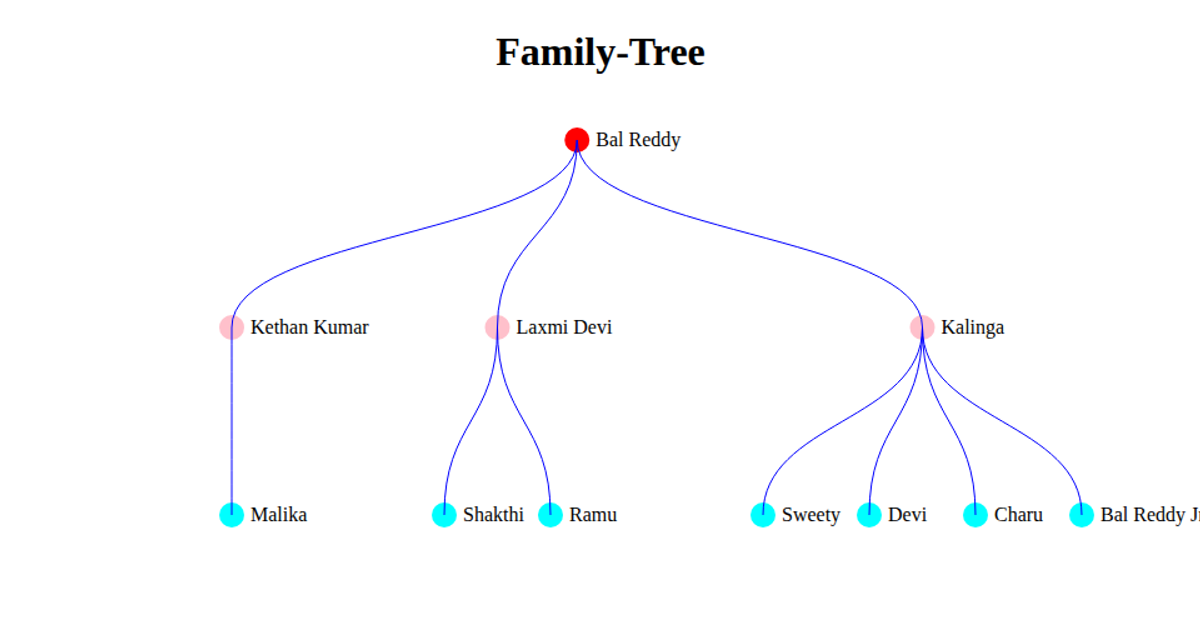
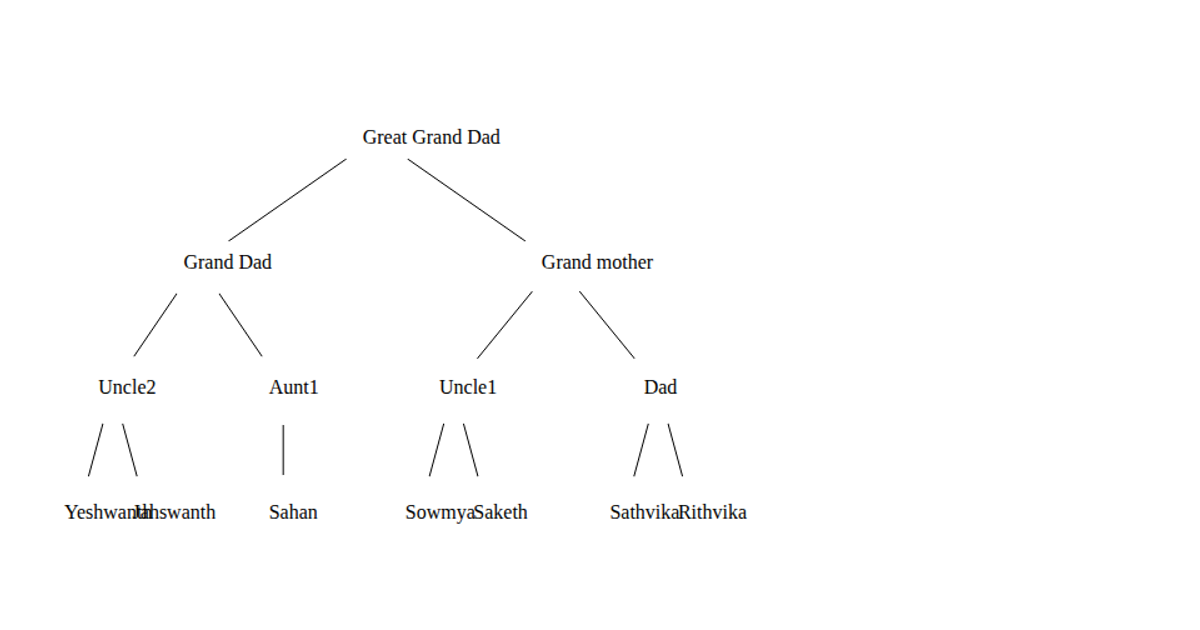
This example shows a family tree diagram with nodes representing individuals from Grandparents down to Alice and Bob, colored by generation depth. The code uses d3.stratify to convert CSV data into a hierarchy, then applies the d3.tree layout to position nodes horizontally. Links are drawn with d3.linkHorizontal, while nodes appear as colored circles with labels, all rendered as SVG within a full-viewport container.
AI-generated descriptionMIT Licensed



Comments
Sign in to join the discussion.