🌍 Public
Fork of Lohiact6_Task3.2
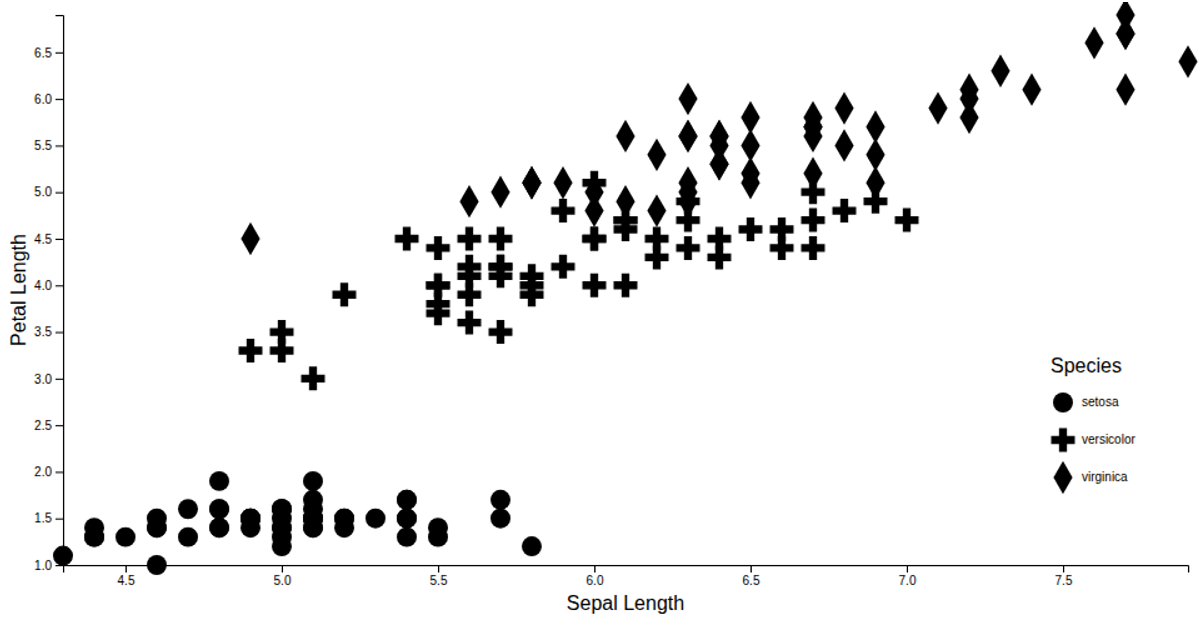
This example shows a scatter plot of the Iris dataset, displaying sepal length against petal length with species distinguished by symbol shapes. The plot includes labeled axes and a shape legend indicating species categories. The visualization uses D3 v7 modules including `scaleLinear`, `scaleOrdinal`, `symbol`, and `symbolsFill` to map data to positions and shapes. Data is loaded asynchronously from a CSV file via `csvParse` and rendered as SVG paths within a full-window viewport.
AI-generated descriptionMIT Licensed




Comments
Sign in to join the discussion.