🌍 Public
Activity 6 tutoral 1
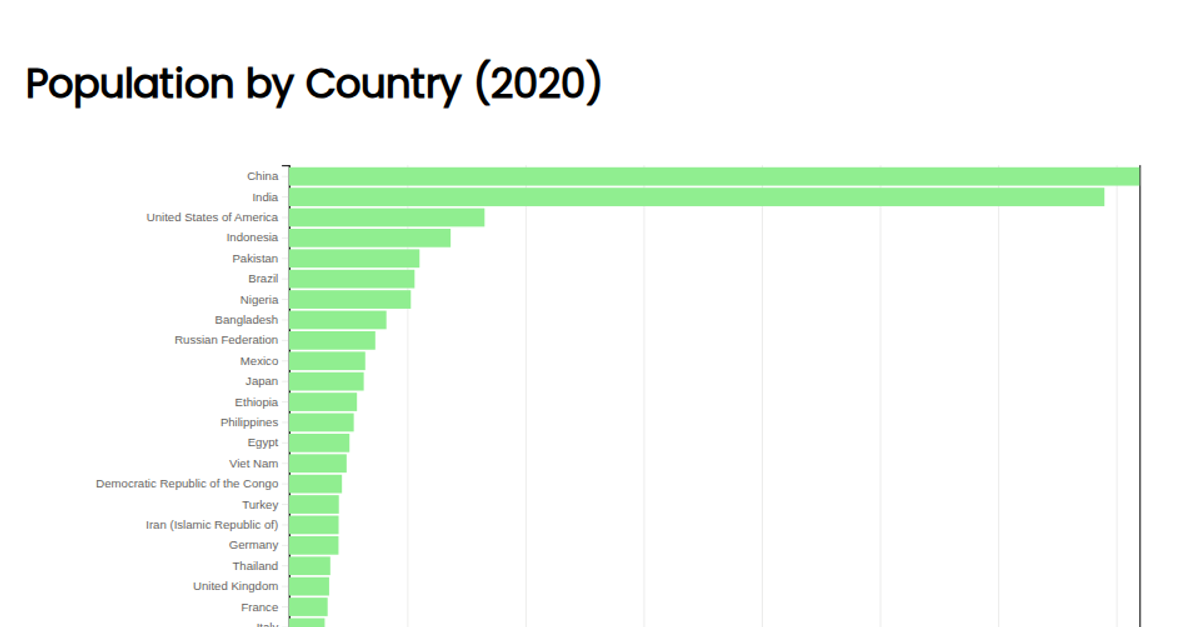
This visualization presents a horizontal bar chart ranking 28 countries by their 2020 population, sorted in descending order from China to Colombia. The chart displays population values on the x-axis in millions, with country names on the y-axis. Built with D3 v7, the code uses `scaleBand` for the categorical y-axis, `scaleLinear` for the numeric x-axis, and `axisBottom`/`axisLeft` for rendering tick marks. Sample population data is embedded directly in the JavaScript, with SVG rectangles representing each bar and light green styling applied via CSS.
AI-generated descriptionMIT Licensed





Comments
Sign in to join the discussion.