🌍 Public
Cheap Tricks for Interaction
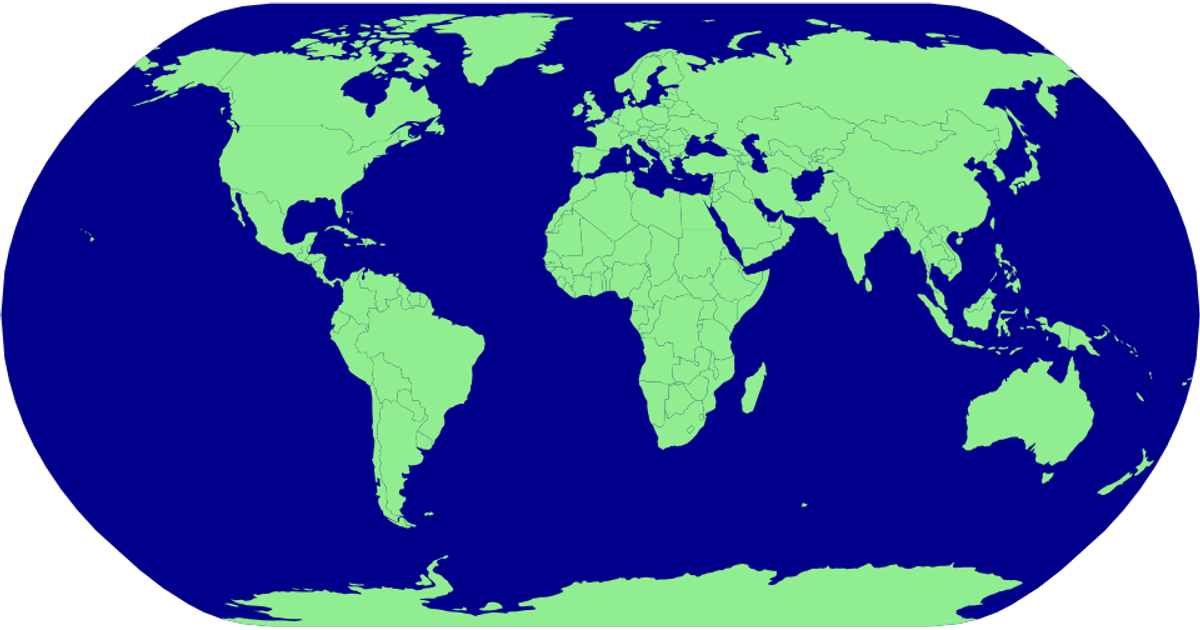
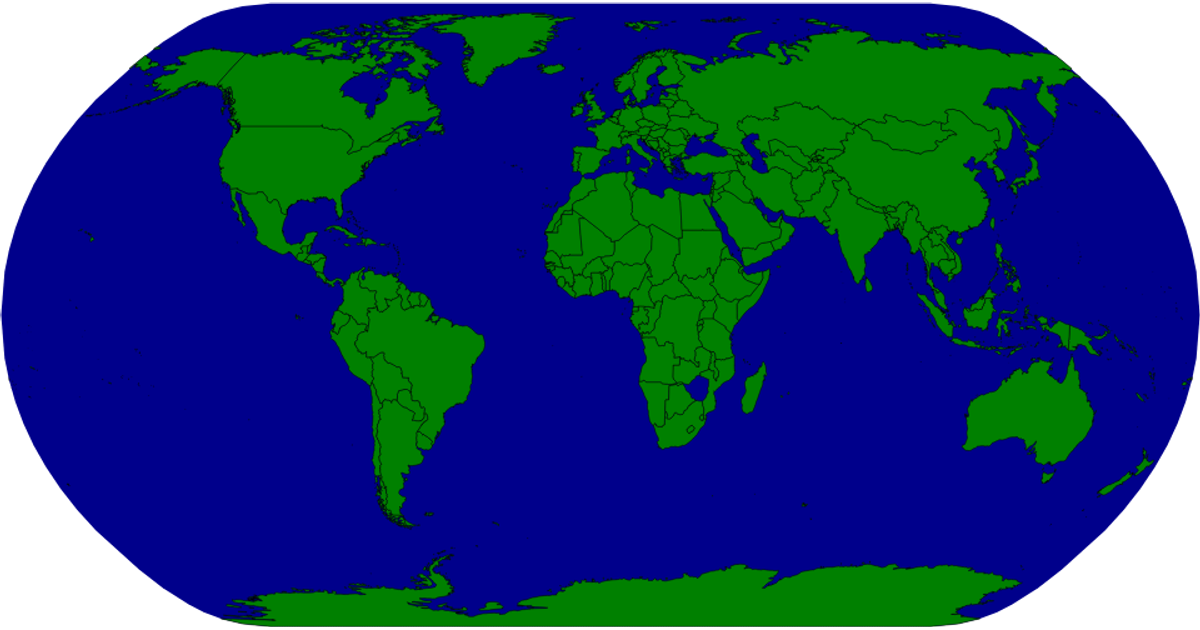
This example demonstrates a zoomable, pannable world map projection using D3.js, where countries are rendered as SVG paths and labeled on demand. The visualization loads geographic data and applies a custom equirectangular projection with a northern center, then uses D3’s `d3.zoom` and `d3.event.transform` to enable smooth scaling and panning interactions. Country highlighting and label backgrounds are styled via CSS classes such as `.country-on` and `.countryLabelBg`, while the map initially hides all labels until zooming or selection occurs.
AI-generated descriptionMIT Licensed




Comments
Sign in to join the discussion.