🌍 Public
Ak's_Line Chart
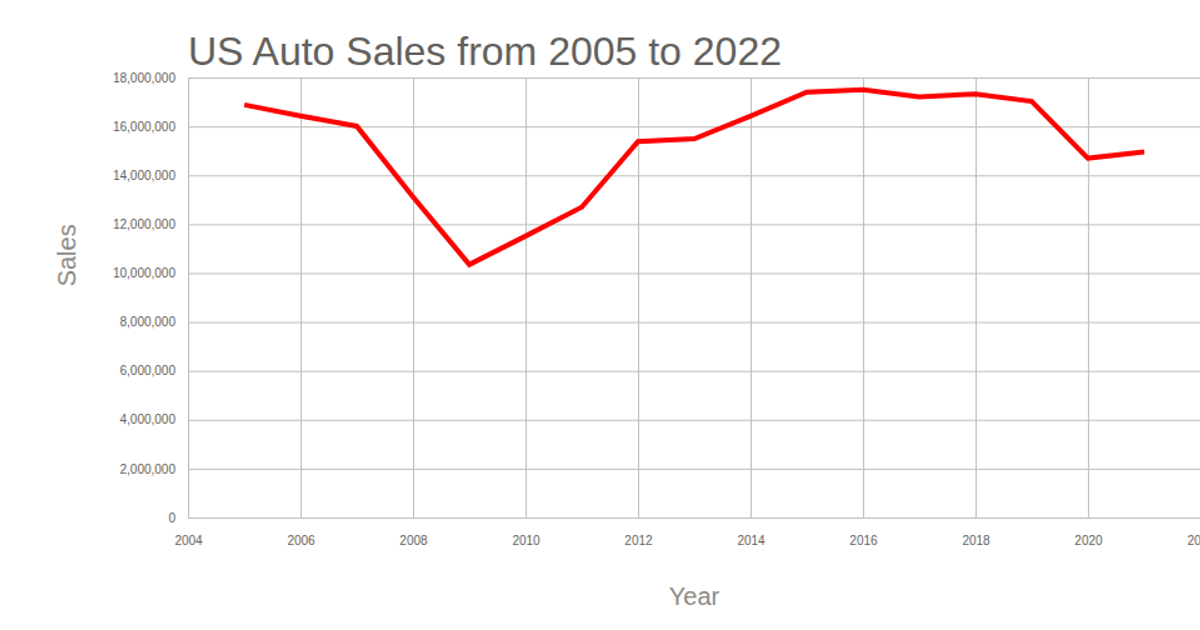
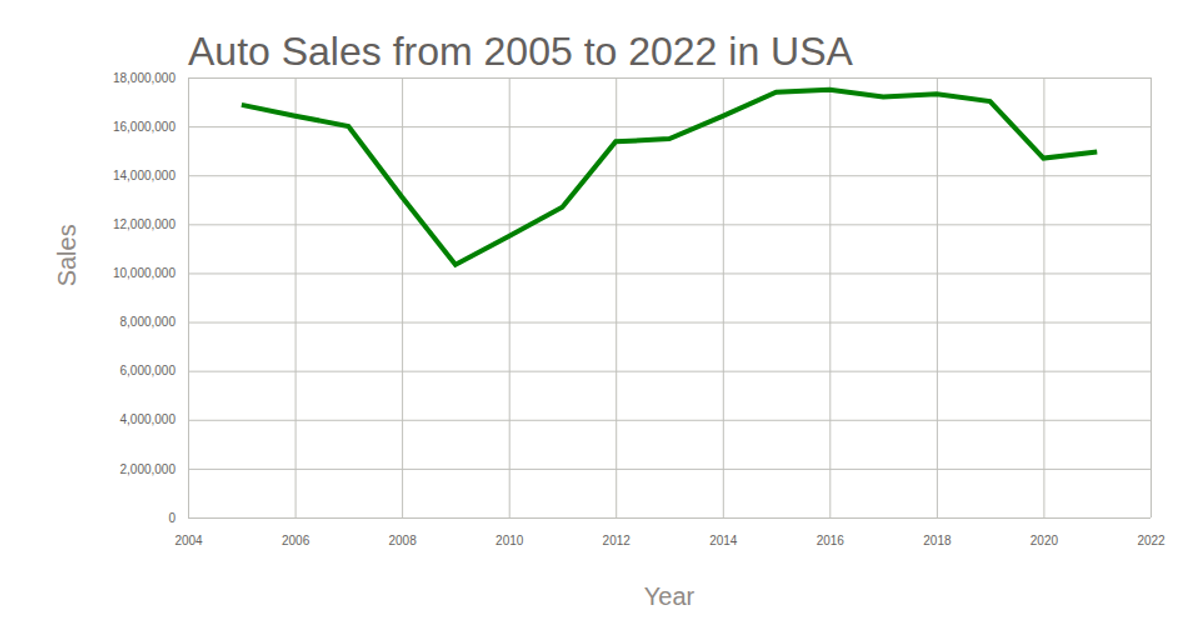
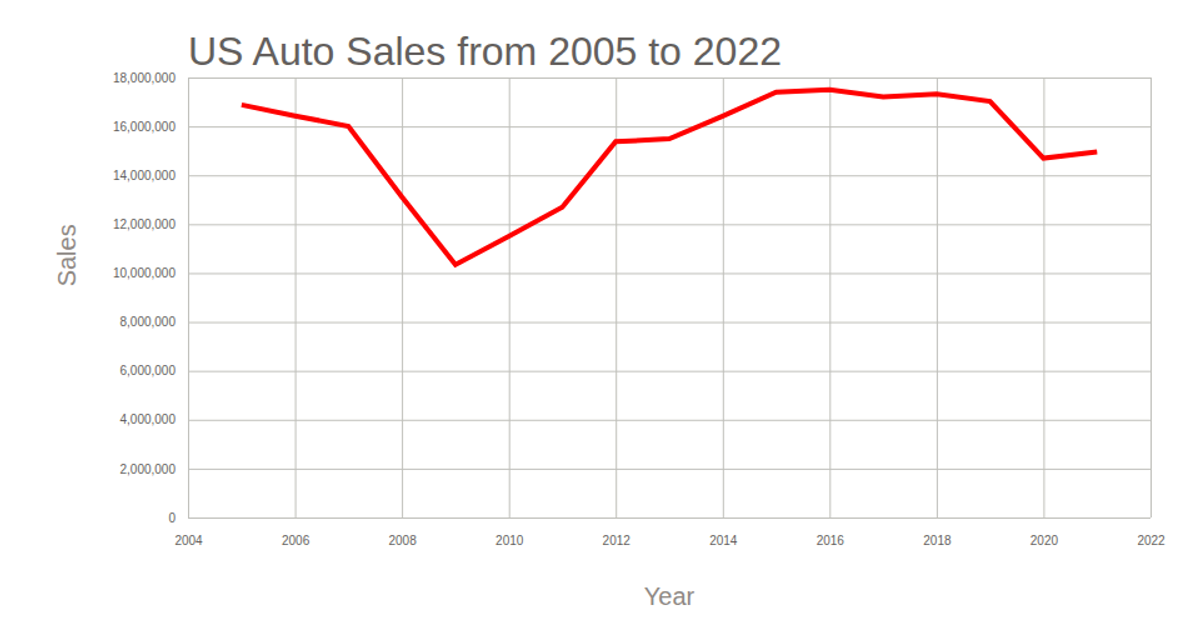
The line chart visualizes US auto sales from 2005 to 2022, using a time-based x-axis for years and a linear y-axis for sales volume, with the trend line rendered in blue over a tan background. The visualization employs D3 v5 APIs including `scaleTime` and `scaleLinear` for axes, `axisBottom` and `axisLeft` for ticks, `line` for the path generator, and `extent` and `max` for domain calculations. Data is loaded asynchronously via `csv` from a public GitHub Gist, and the SVG output includes rotated axis labels and a descriptive title.
AI-generated descriptionMIT Licensed




Comments
Sign in to join the discussion.