CS 360 Assignment 2 - Dot Plot
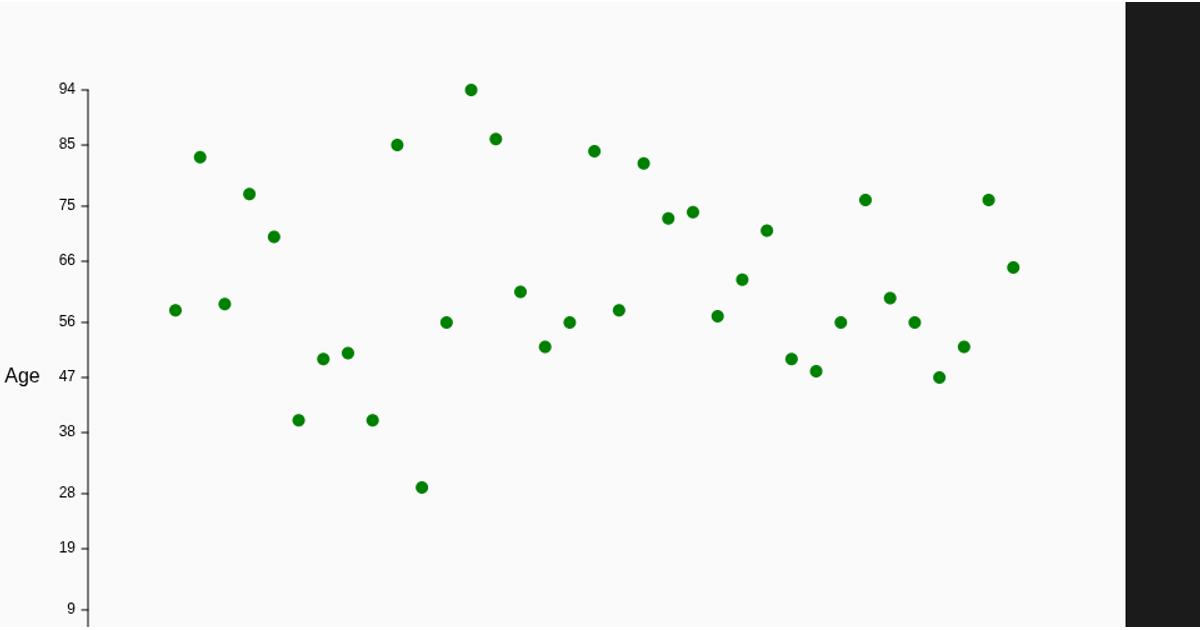
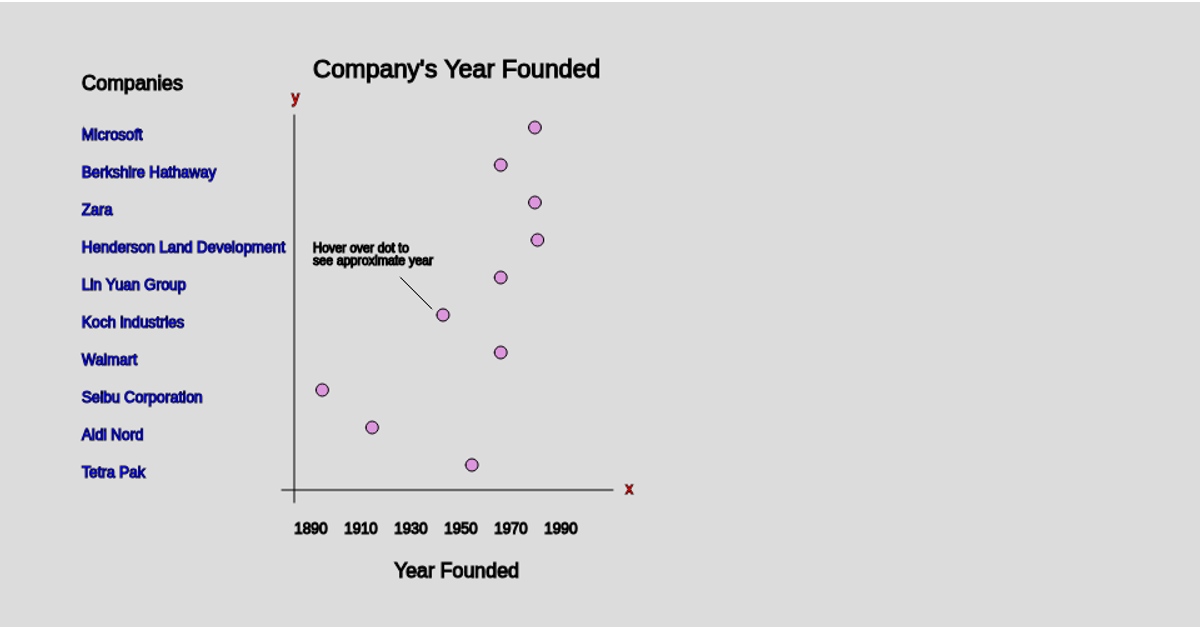
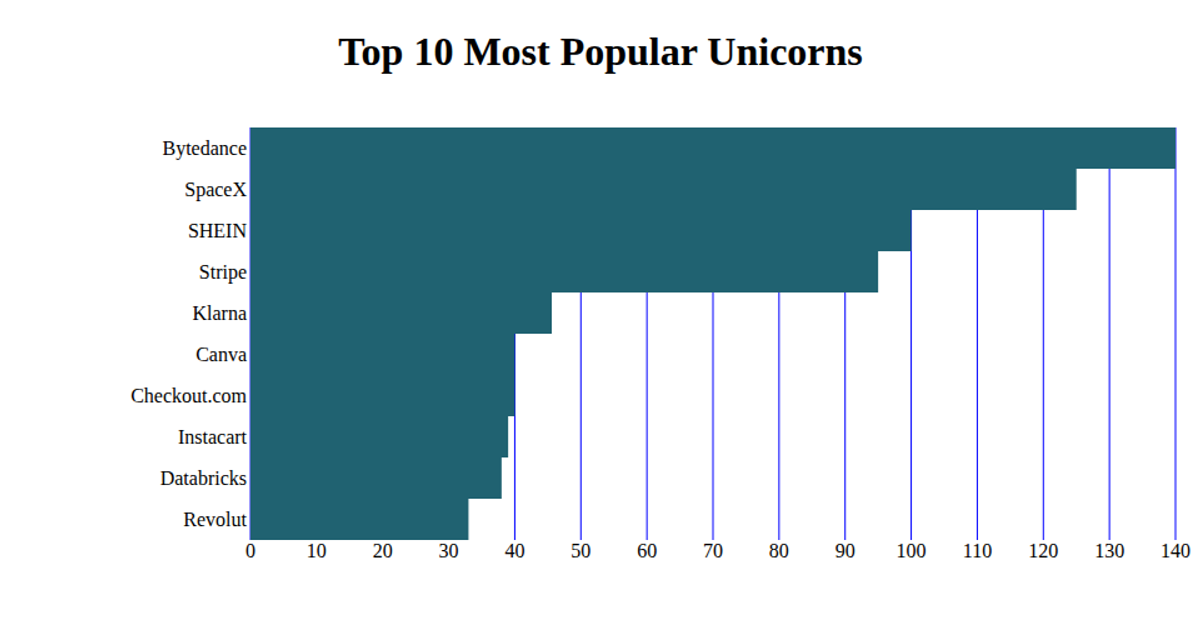
This dot plot visualizes the top 10 startups by overall valuation, with each dot representing a company’s valuation in billions of dollars. The chart uses p5.js to load CSV data from a Google Sheets URL, then draws a titled grid with tick marks and horizontal lines, plotting each startup’s value as a filled ellipse. The data originates from a Kaggle dataset on startup valuations, cleaned and reduced to the top 10 entries. The visualization’s axes and labels are manually positioned using p5.js canvas drawing functions.
AI-generated descriptionA bare minimum HTML page demonstrating use of CSS and JavaScript.
See also React Starter.
original dataset can found in the kaggle link below https://www.kaggle.com/khaiid/startups-by-valuation
data was cleaned and reduced to the top 10 startups overall based on valuation python code is below
https://github.com/seansanchez951/CS-360---Assignment-2-Dot-Plot-Data-Cleaning-Python


Comments
Sign in to join the discussion.