🌍 Public
Point Marks
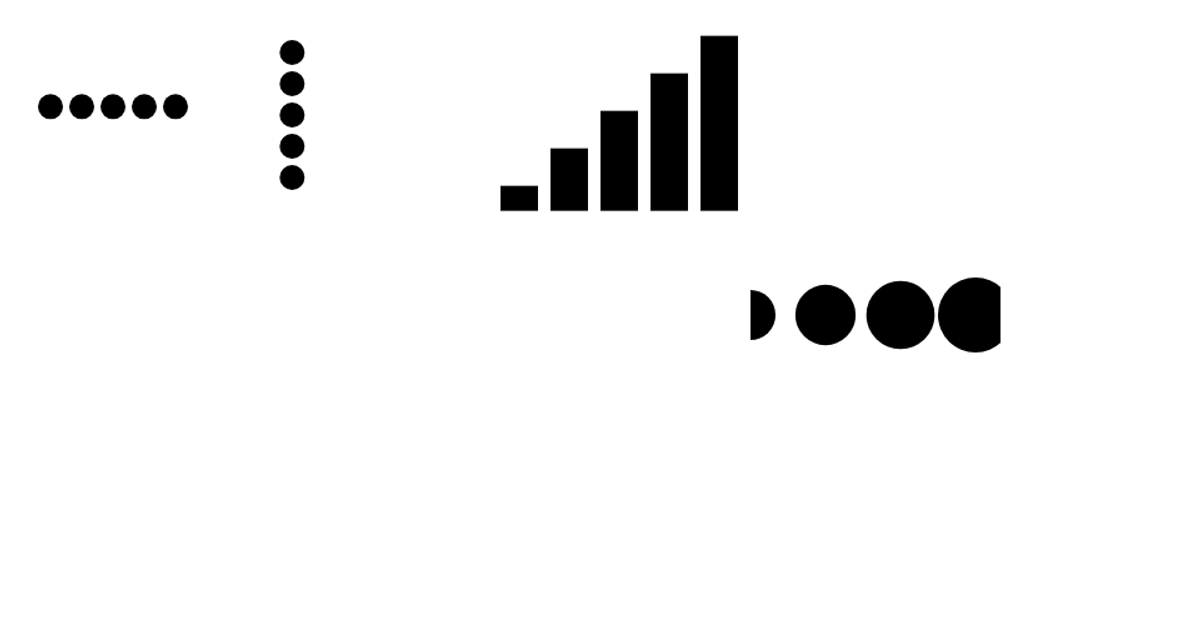
Five small multiples demonstrate how a single dataset can be encoded with different visual channels: x-position, y-position, bar length, circle area, and symbol shape. Each panel uses the same array of five values, rendered as either rect, circle, or path elements via d3.selectAll and .join. The code applies d3.symbol and symbolsFill to generate distinct shapes, adapting marks to communicate the same numbers through each channel.
AI-generated descriptionA circle that follows the mouse.
MIT Licensed




Comments
Sign in to join the discussion.