🌍 Public
It has dataCsv - Making a bar chart
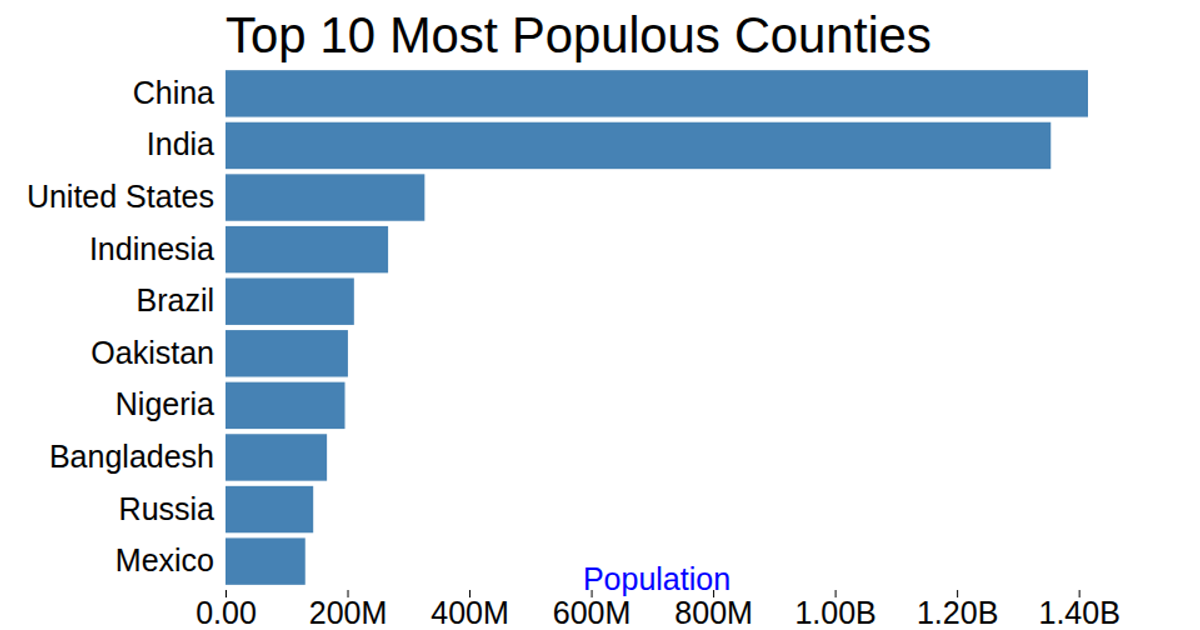
This bar chart displays the population of the top 10 most populous countries, with values sourced from the World Population Prospect 2017 via a local CSV file. Using D3 v5’s `csv`, `scaleLinear`, and `scaleBand`, it maps population counts to bar widths and country names to vertical bands. The chart renders as an SVG with gridlines from `axisBottom`, formatted tick labels via `format`, and a title and axis label. Data values are multiplied by 1,000 in the loading callback.
AI-generated descriptionThe bar chart show population of the top of 10 most popluois countries. The data comes from World Population Prospect 2017.
MIT Licensed


Comments
Sign in to join the discussion.