🌍 Public
Fork of Map
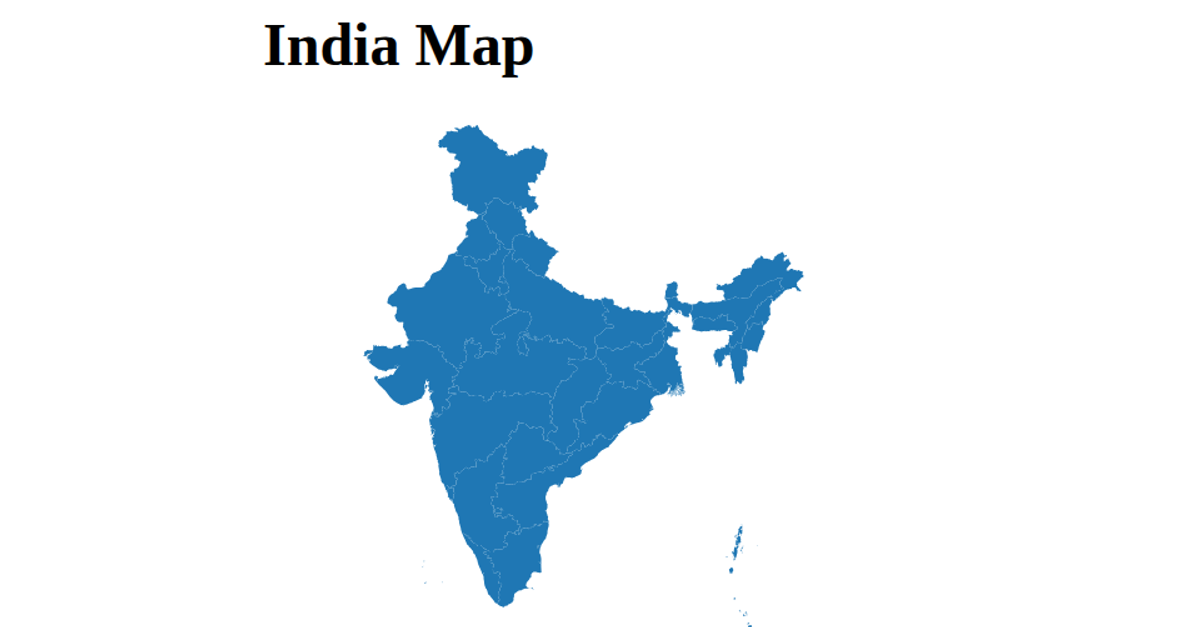
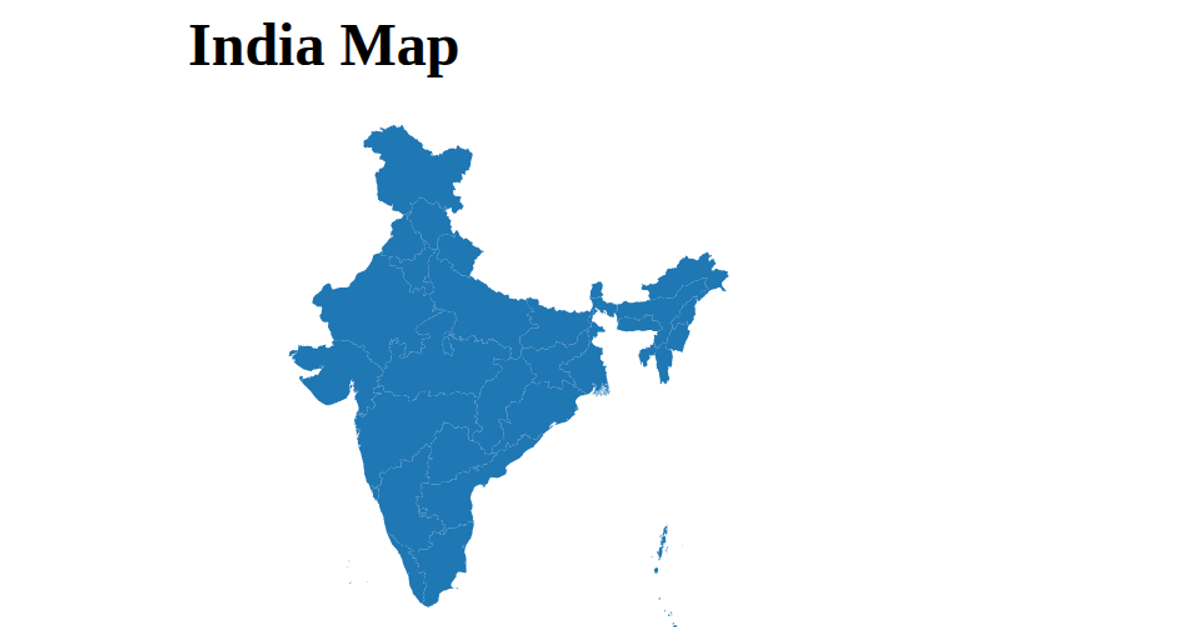
This D3.js example displays a map of India, focusing on the Bangalore region with a light blue fill and black borders. It loads TopoJSON data from a GitHub gist and converts it to GeoJSON using the topojson library's `feature` function. The map is rendered as SVG paths using the `geoPath` and `geoMercator` projection from D3 v5, with a categorical color scale available but not applied in the visible output.
AI-generated descriptionA bare minimum HTML page.
MIT Licensed






Comments
Sign in to join the discussion.