🌍 Public
fork test for MBB
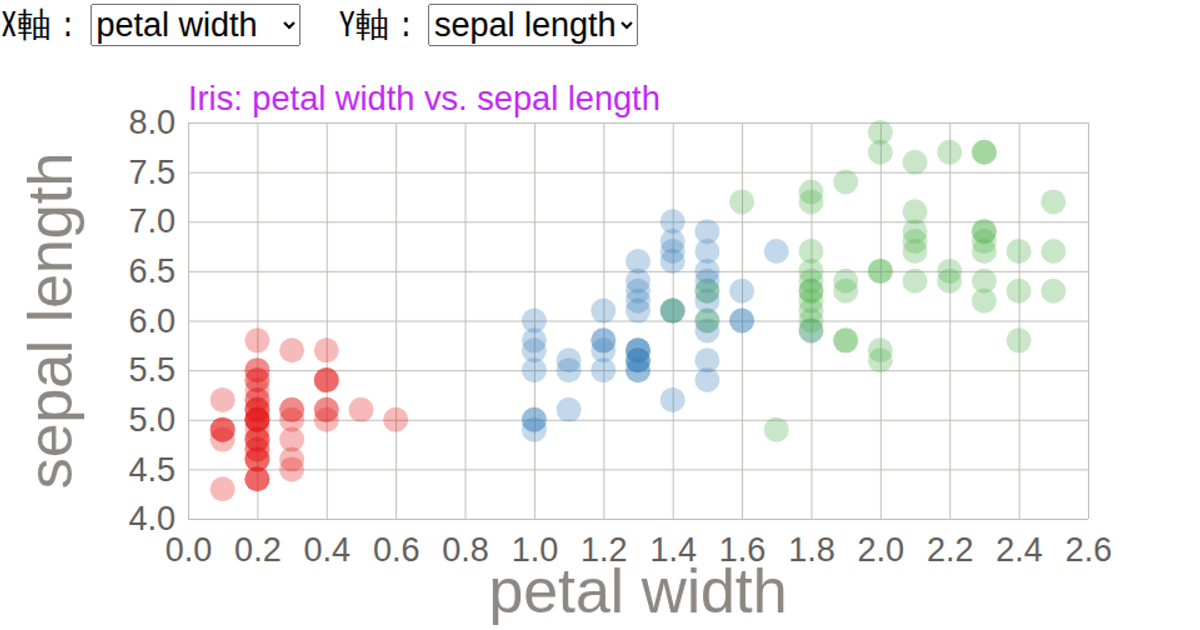
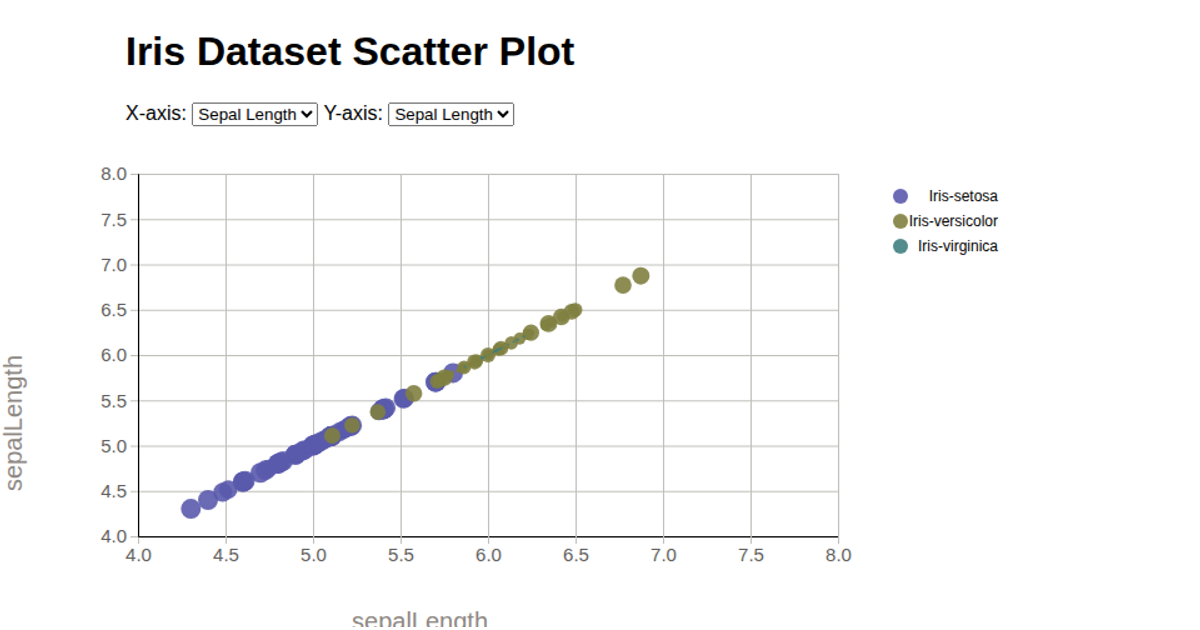
This interactive scatter plot visualizes the Iris flower dataset, allowing users to compare any two of its four measurements (sepal length, sepal width, petal length, petal width) via dropdown menus. Points are color-coded by species and animate smoothly to new positions when the axis selection changes. Built with D3 v7, the visualization uses `d3.scaleLinear`, `d3.axisBottom`, and `d3.axisLeft` to construct the plot, while `transition().duration(2000)` animates the circles. Data is loaded from a CSV file using `d3.csv`, and SVG is used for rendering.
AI-generated descriptionA bare minimum HTML page demonstrating use of CSS and JavaScript.
See also React Starter.
MIT Licensed




Comments
Sign in to join the discussion.