🌍 Public
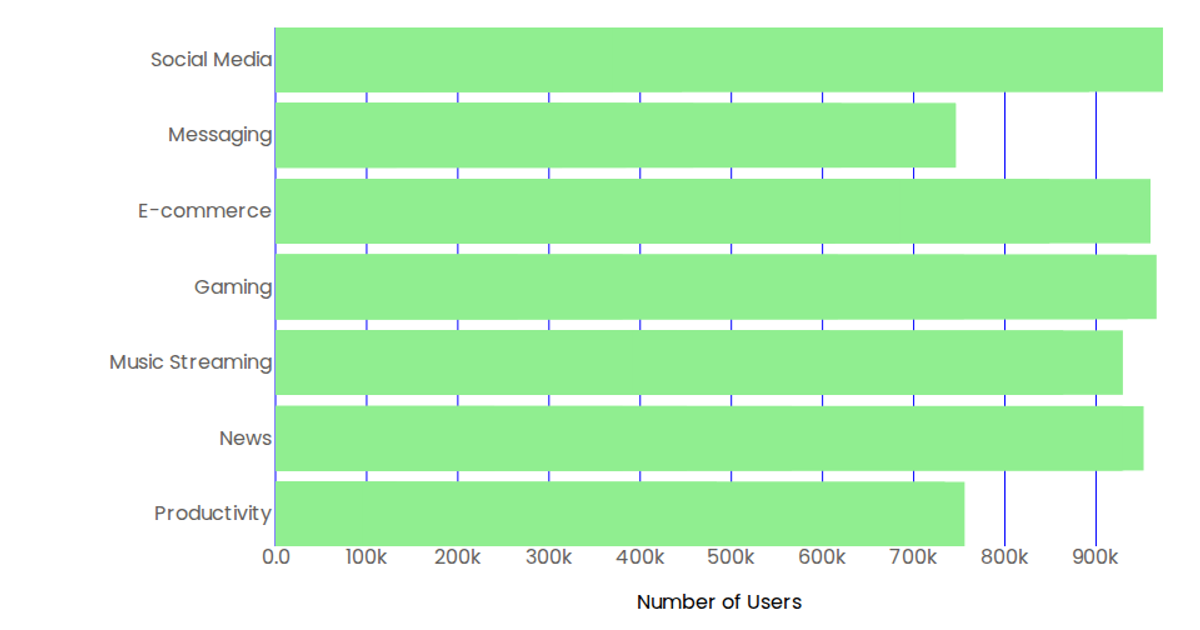
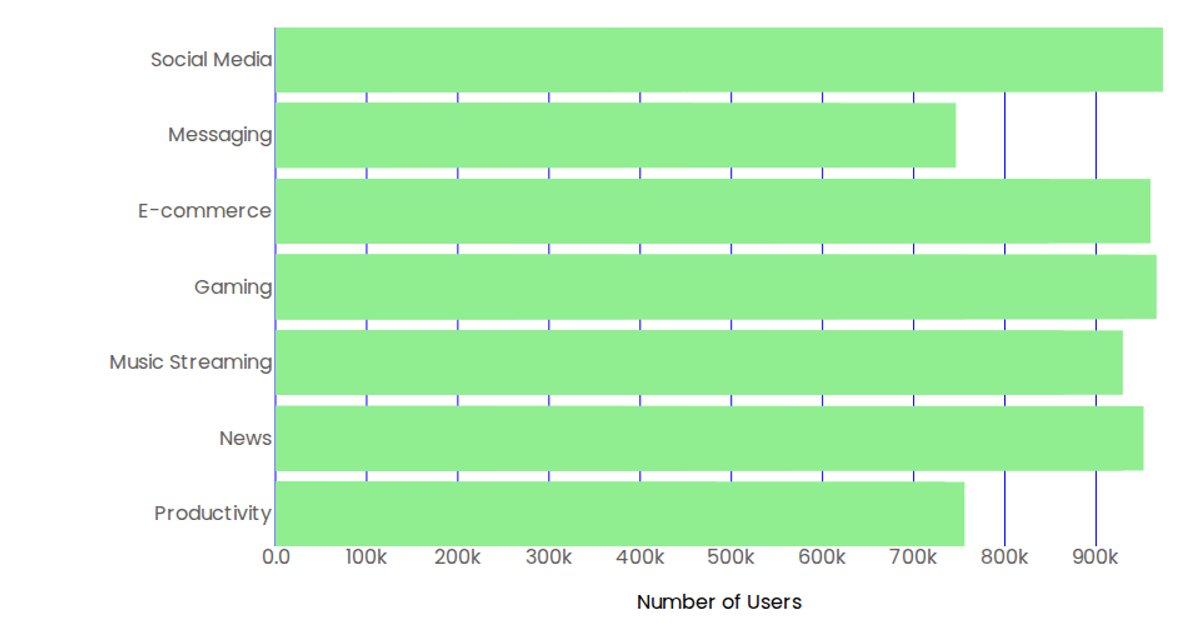
Bar chart - application access counts
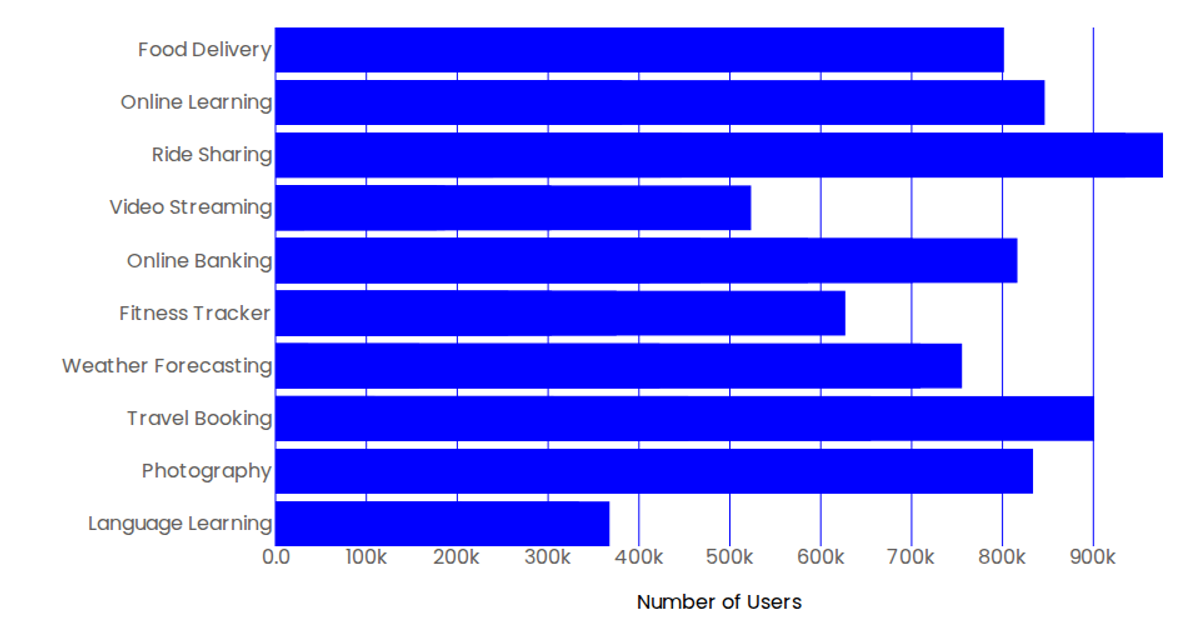
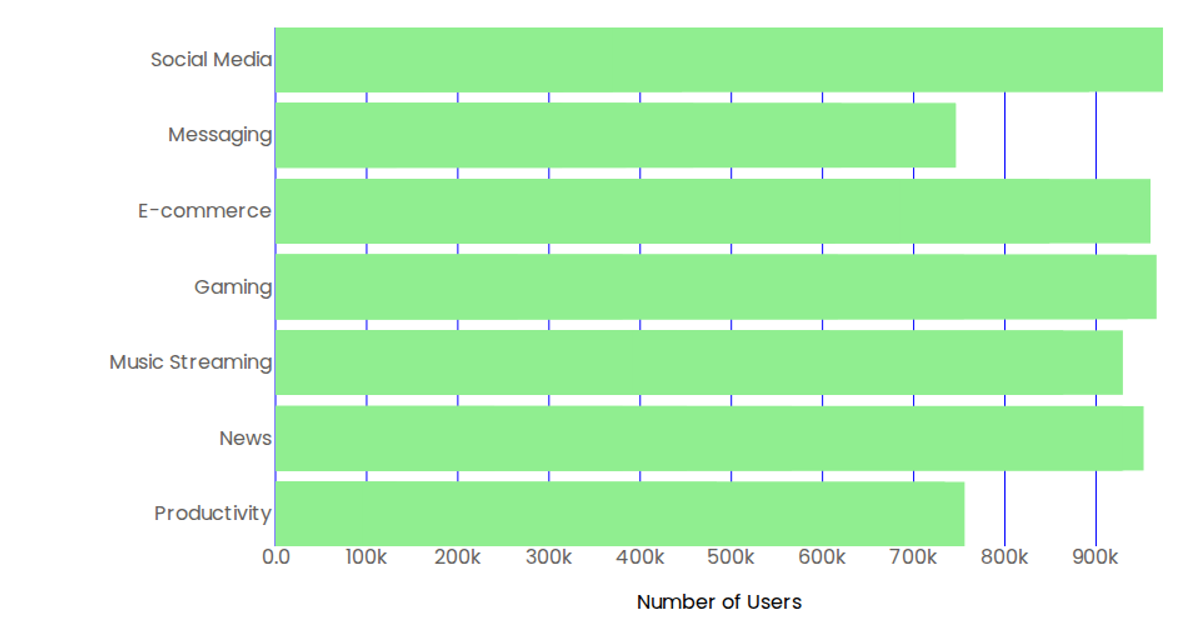
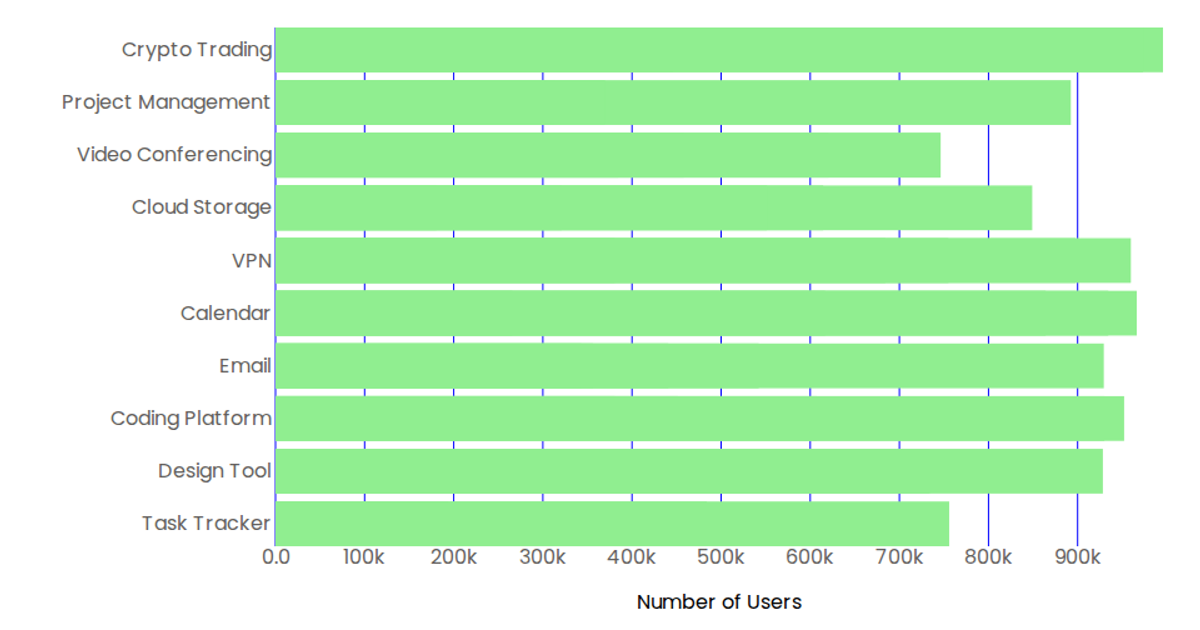
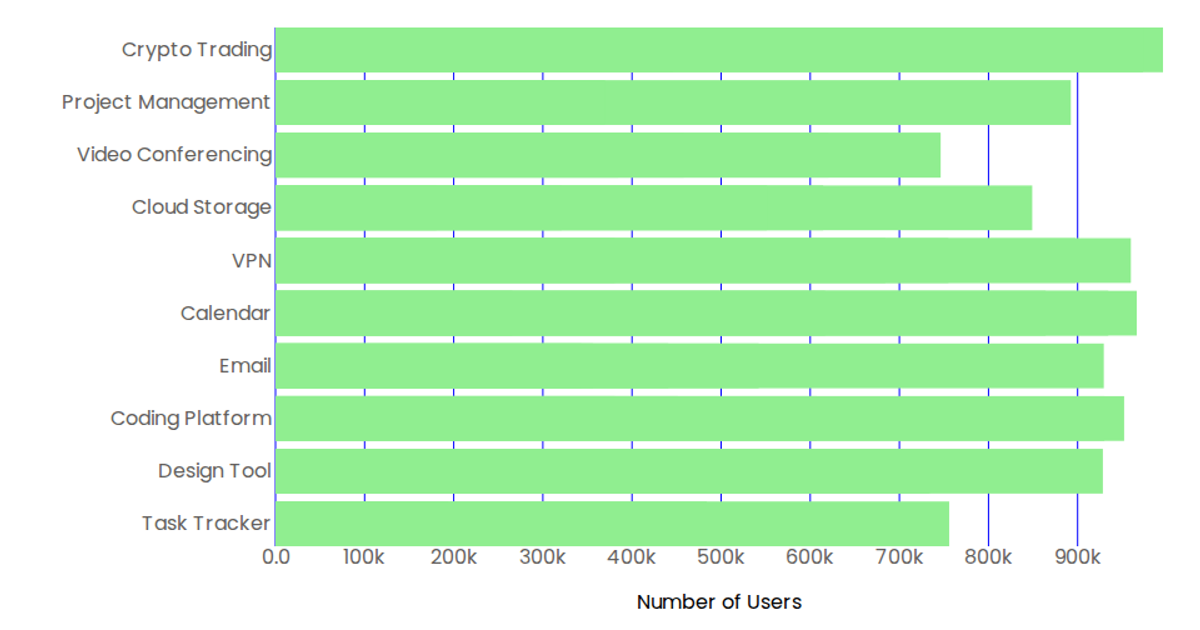
This bar chart shows the number of times each of six applications was accessed. It displays the access counts for Authentication, Lab, Sales Inventory, HR, Accounting, and Website, with each bar labeled with both the application name and its corresponding count. The visualization uses D3 v7 to render SVG rectangles, with a linear scale powering the left axis and tick lines, and the bars’ blue color intensity is normalized against the maximum access count. Data is loaded from a JSON file using `d3.json`.
AI-generated descriptionMIT Licensed


Comments
Sign in to join the discussion.