🌍 Public
MOULI ICE-6
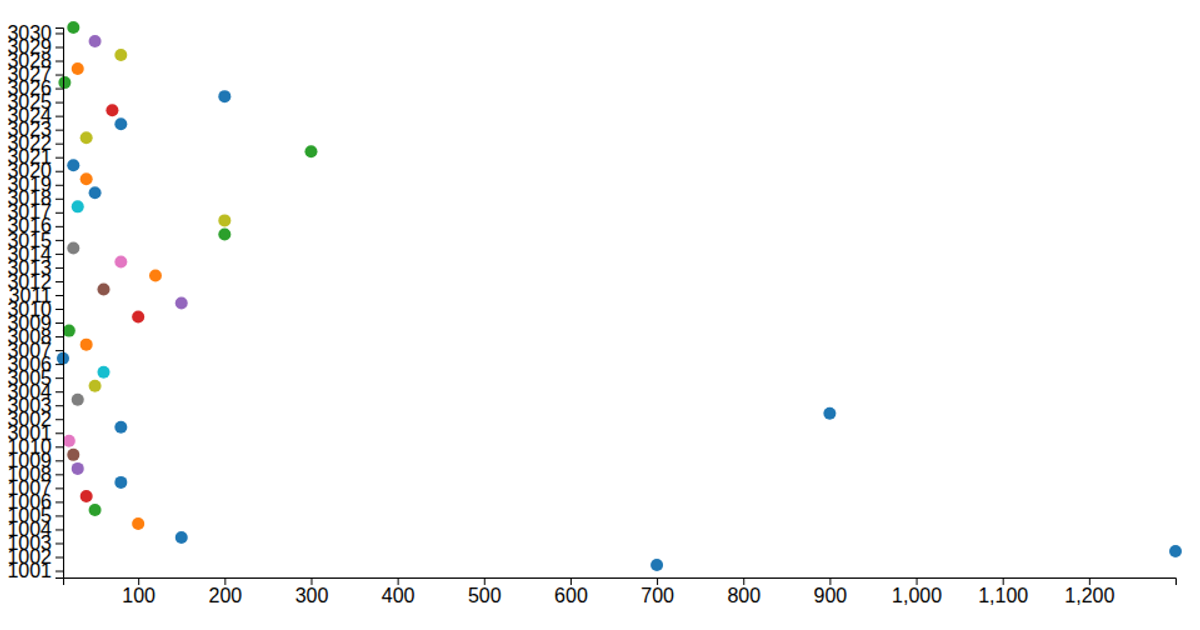
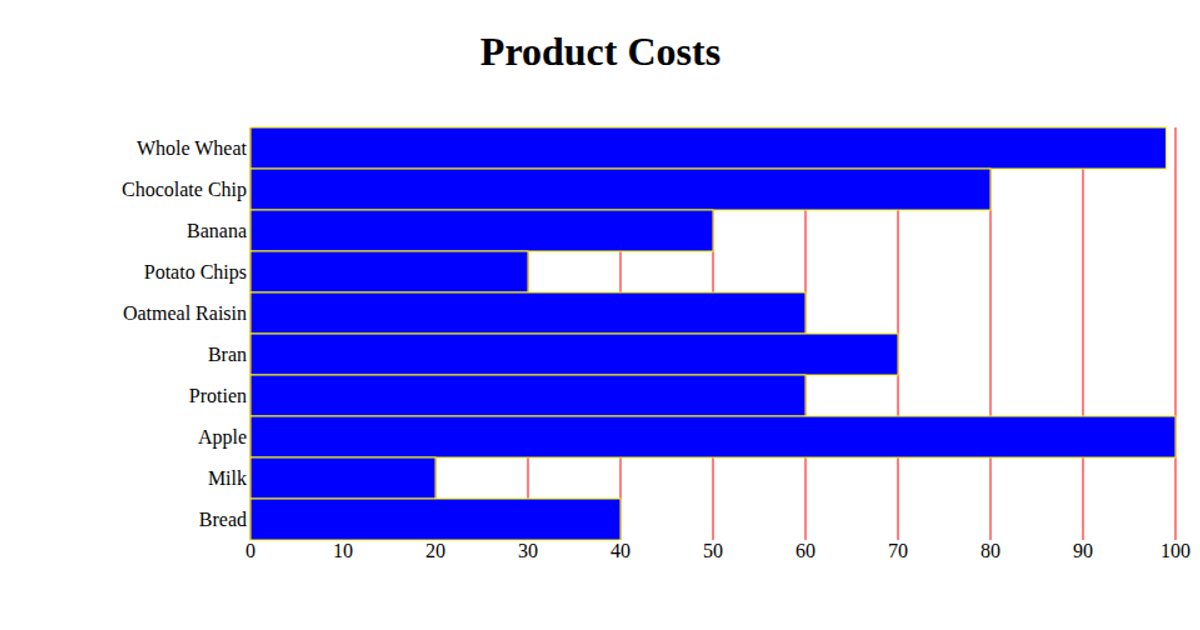
MOULI ICE-6 displays a responsive scatter plot that encodes product prices as horizontal bars sorted in ascending order, with a light-to-dark blue color gradient mapping price magnitude. The visualization uses React for component state management and D3.js v5 for data loading and scales, specifically `scaleBand` for product categories and `scaleLinear` for price values. The data comes from a CSV file loaded via D3’s `csv` method, and the rendering is done entirely in SVG. The chart includes labeled axes and gridlines, with product names placed along the vertical axis and price values on the horizontal axis.
AI-generated descriptionA responsive scatter plot.
MIT Licensed


Comments
Sign in to join the discussion.