🌍 Public
Marvel vs DC scatter plot
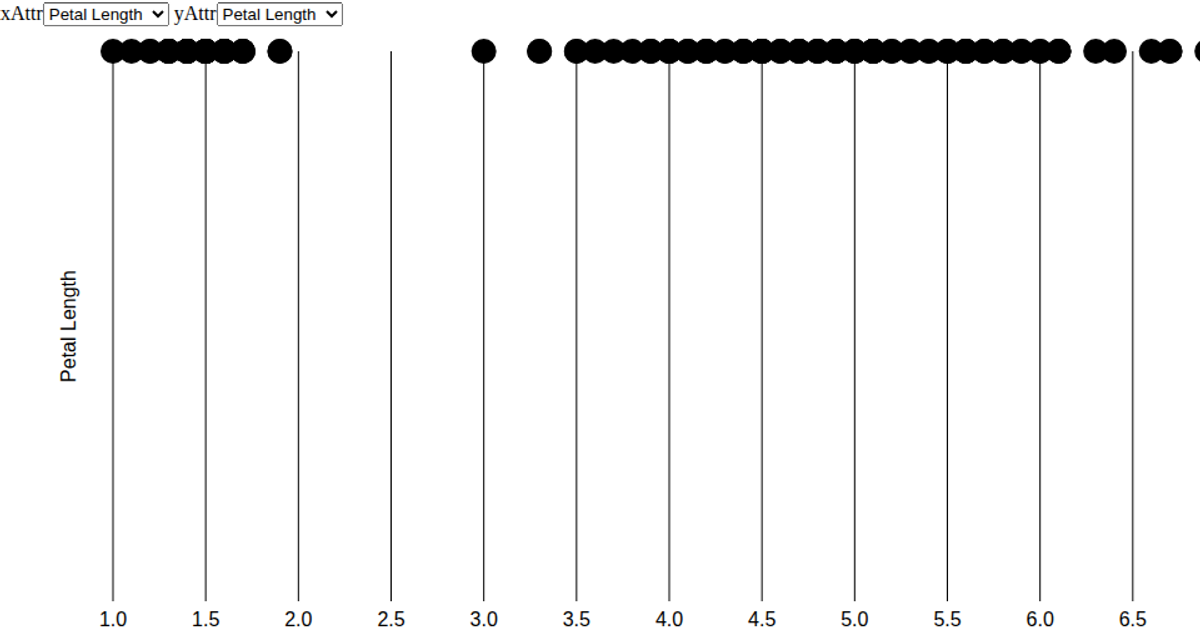
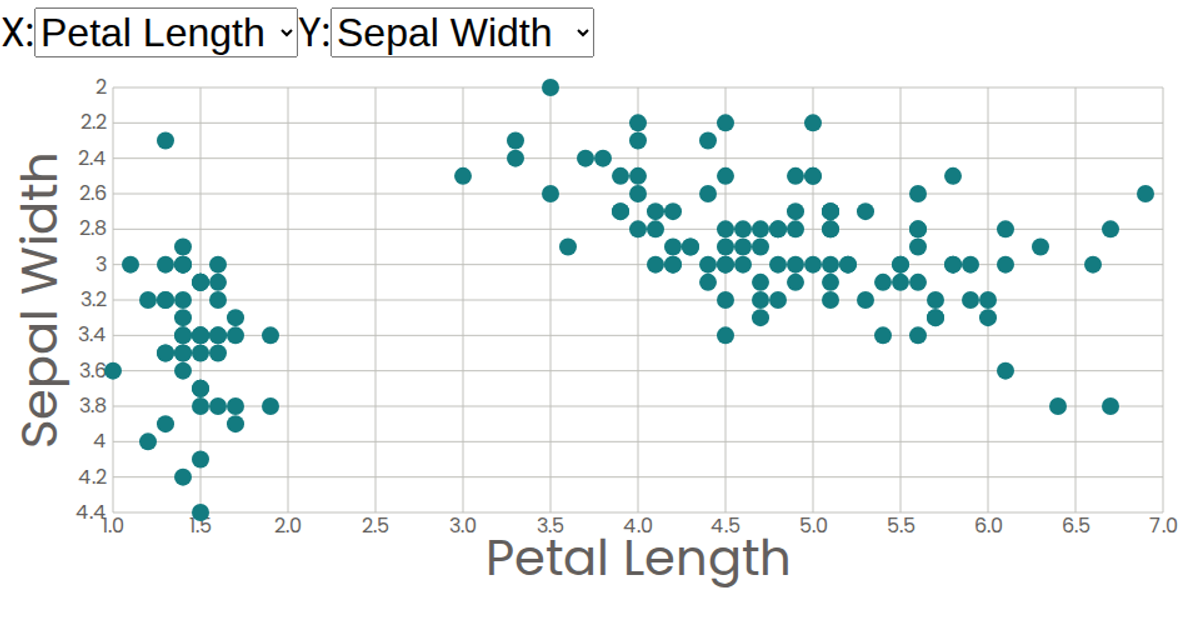
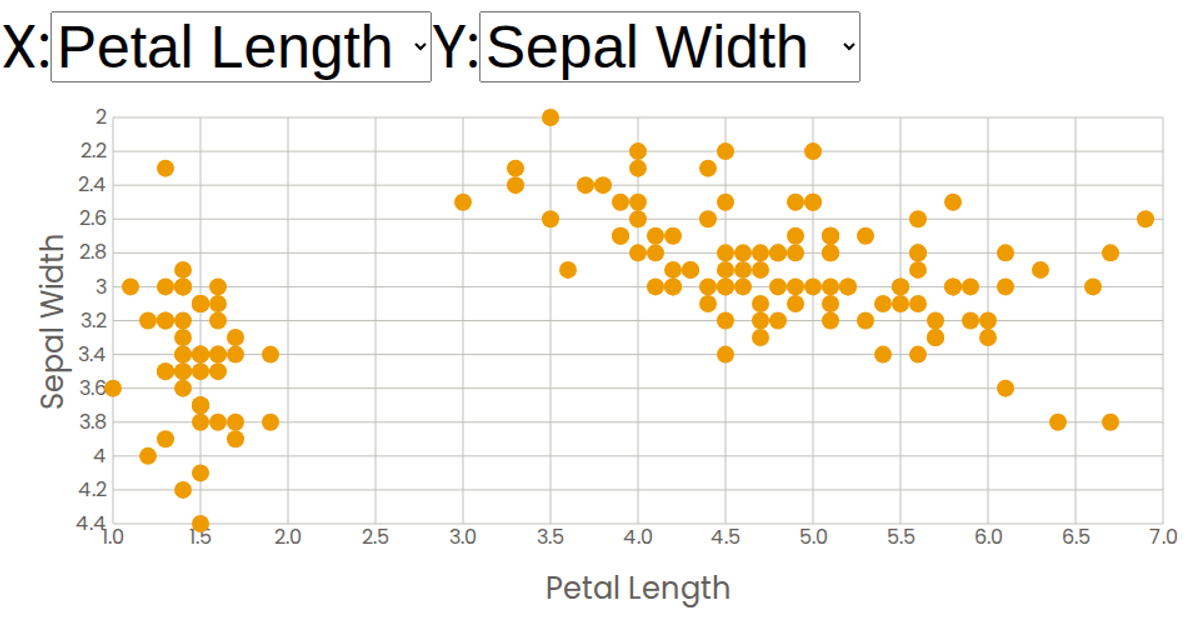
A scatter plot displays the Iris Dataset, plotting sepal and petal measurements against each other. Interactive dropdown menus allow switching which measurement appears on the X and Y axes, with the plot updating accordingly. The visualization is built with React and D3 v5, using `scaleLinear` and `extent` for axes and `ReactDropdown` for the menu controls. SVG circles represent data points, rendered through custom React components, with axis ticks and labels generated by the provided helper components.
AI-generated descriptionA scatter plot of The Iris Dataset.
MIT Licensed



Comments
Sign in to join the discussion.