🌍 Public
sales dataset
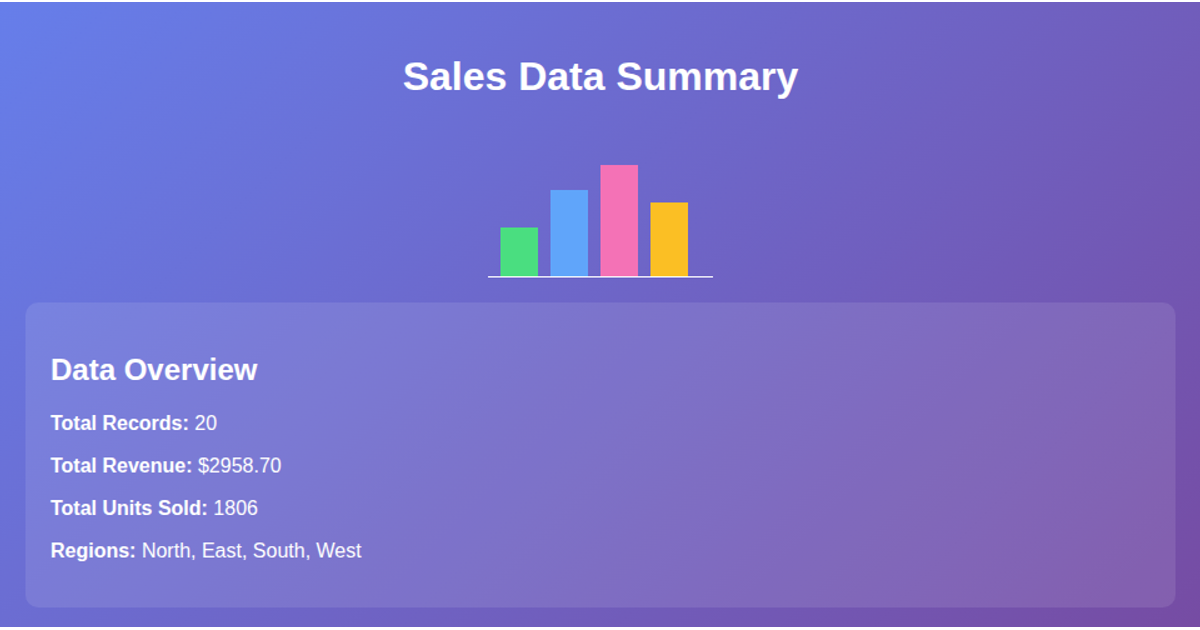
This visualization summarizes a sales dataset loaded from a CSV file via `fetch` and parsed with `d3.csvParse`. It displays total profit by region and total revenue by item type as SVG bar charts, alongside summary statistics and top countries by revenue in chip cards. The code uses D3 v7 for data binding, scales, and axis generation, with a warm color palette and hover effects on bars.
AI-generated descriptionMIT Licensed


Comments
Sign in to join the discussion.