🌍 Public
Let's make a map with D3.js!
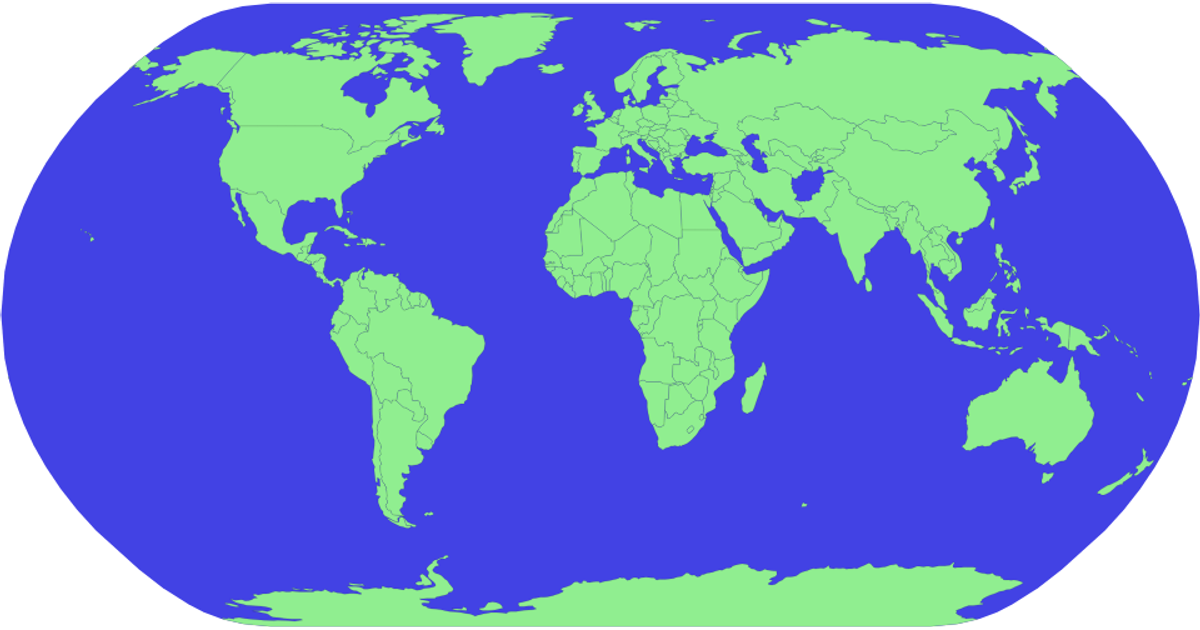
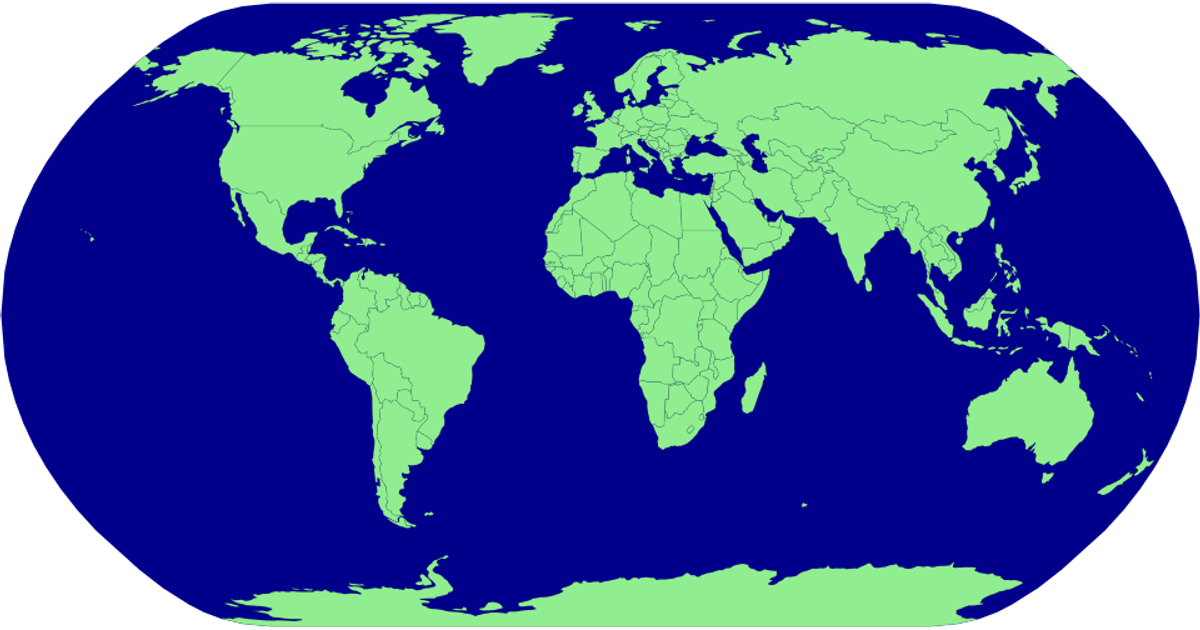
This example displays a world map with countries rendered as light green landmasses against a blue sphere, projected using the Natural Earth 1 projection. The visualization loads geographic data from the world-atlas TopoJSON source and renders it as SVG paths, using D3’s `geoPath` and `geoNaturalEarth1` APIs for projection. Country boundaries appear with a faint black stroke, while the sphere background fills the canvas.
AI-generated descriptionMIT Licensed




Comments
Sign in to join the discussion.