🌍 Public
Fork of Reusable _scatter_Plot
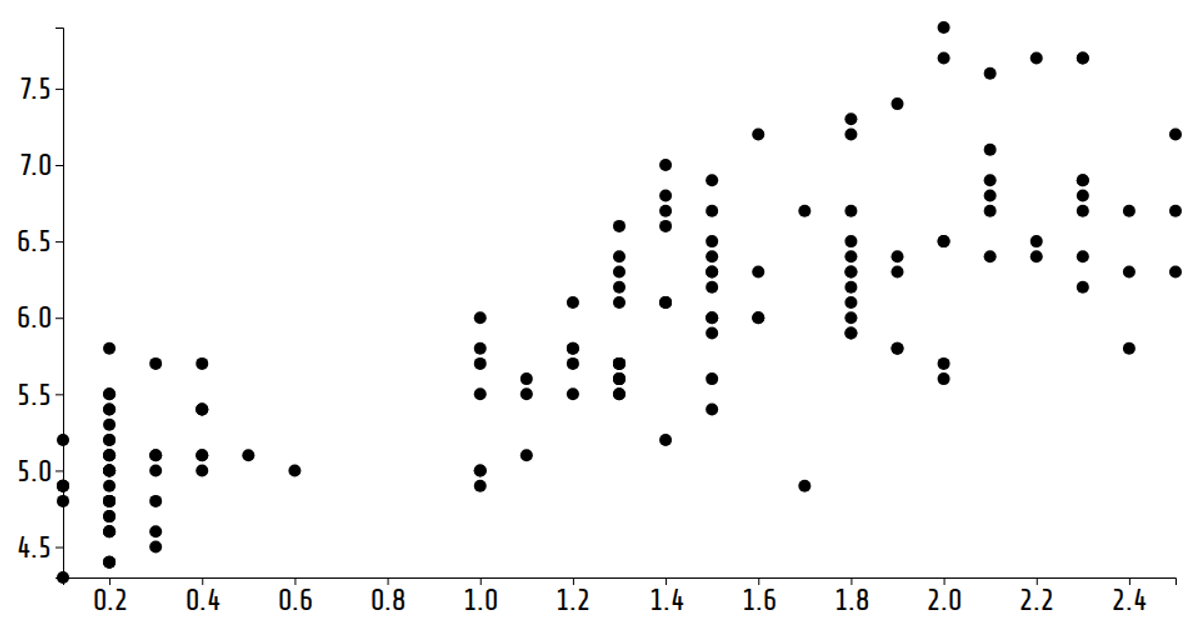
This scatter plot visualizes the Iris dataset, showing the relationship between petal width and sepal length. The code uses d3.scaleOrdinal to color-code data points by species, with a custom legend and axis labels. Animated transitions cycle through different attribute combinations every two seconds using setInterval. Built with D3.js version 6.7.0, the visualization renders as an SVG with reusable scatterPlot components and dynamic window sizing.
AI-generated descriptionA scatter plot of The Iris Dataset.
MIT Licensed






Comments
Sign in to join the discussion.