🌍 Public
KMeans clustering
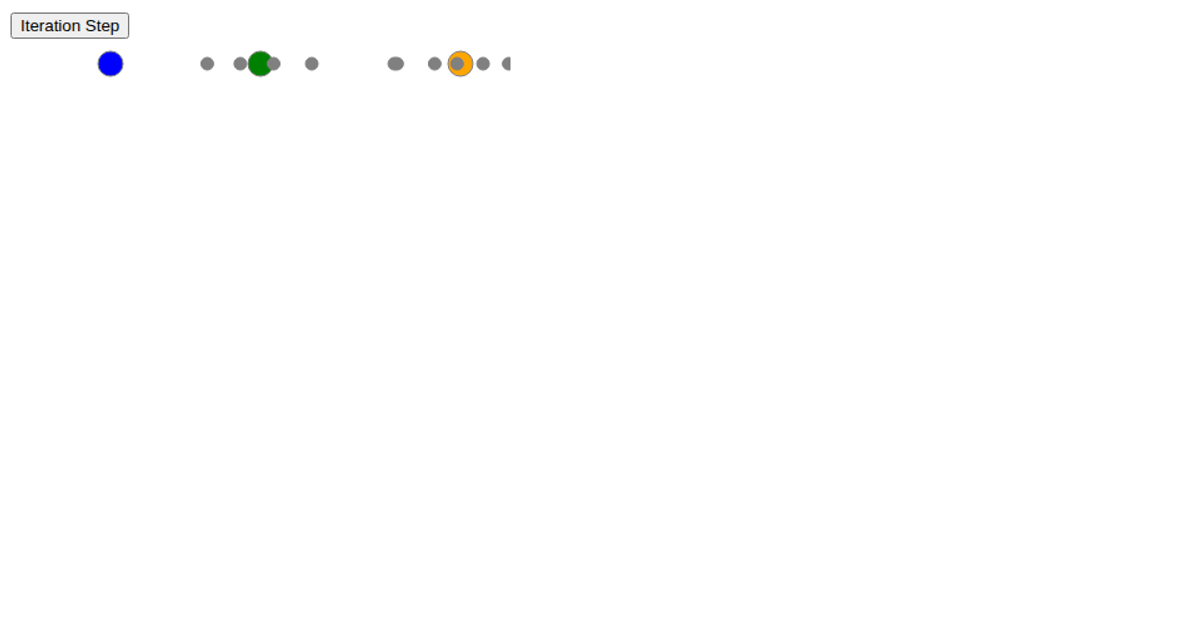
This example demonstrates KMeans clustering on a small dataset of six points loaded from a CSV file. It shows how points are iteratively assigned to one of three clusters, with colored hulls drawn around each group and centroids recalculated until a local minimum cost is reached. The visualization uses D3.js v4 with a React framework, rendering SVG circles and polygon hulls with animated transitions. The code employs `d3.csv`, `d3.polygonHull`, `d3.scaleLinear`, and `d3.interval` to animate the clustering process, displaying the iteration count in the final state.
AI-generated descriptionA bare minimum HTML page.
See also React Starter.
MIT Licensed






Comments
Sign in to join the discussion.