🌍 Public
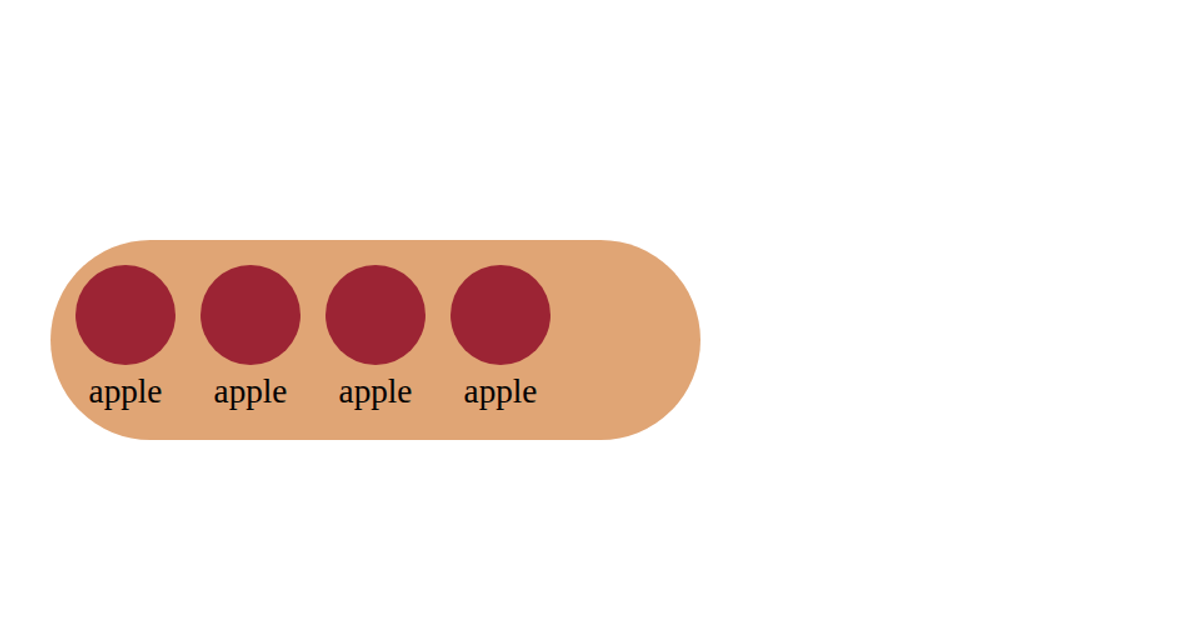
Make the bown of fruits
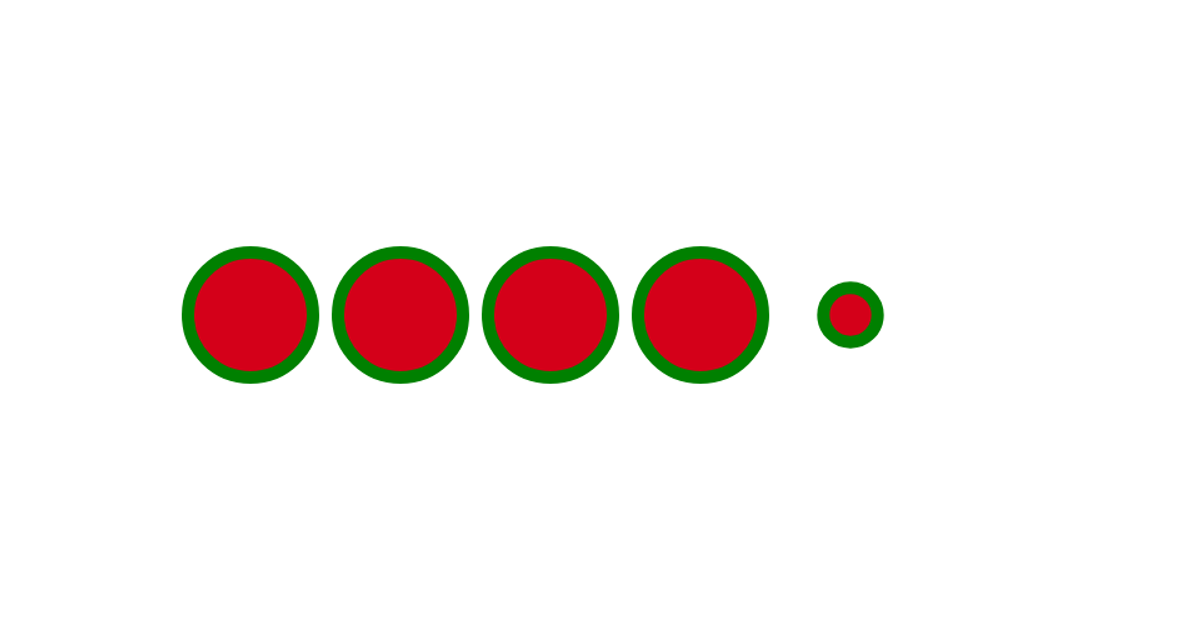
Ten red apples appear in a row, and after a second one is removed. A moment later, the apple in the sixth position turns into a lemon, changing color and size. The visualization uses D3's `select`, `range`, and `scaleOrdinal` to map fruit types to visual properties and handle the dynamic updates. The SVG scene is rendered with `d3.merge` and `exit`/`remove` to animate changes, while the title and styling come from the CSS file.
AI-generated descriptionAfter completing the line chart ,, now we gonna do the area chart which is not that hard, when you know to do the line chart.
MIT Licensed




Comments
Sign in to join the discussion.