🌍 Public
Entertainment Options in Different States
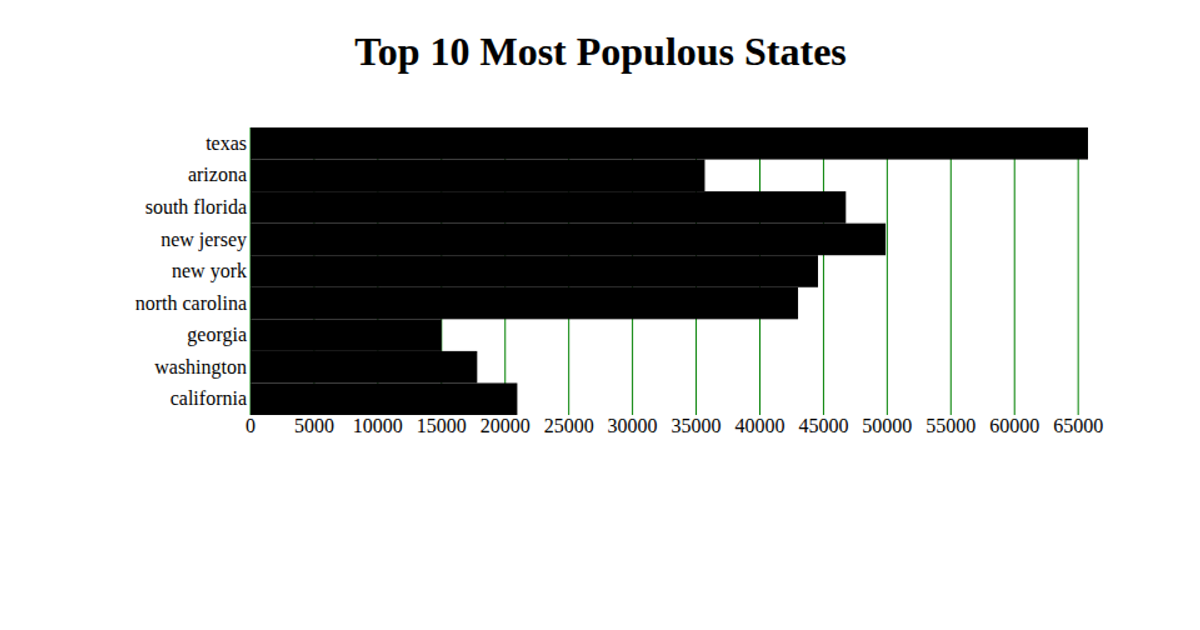
This example shows the cost of entertainment options in twelve U.S. states using a horizontal bar chart rendered as SVG with React. The chart displays state names on the y-axis and numerical cost values on the x-axis, with red tick lines and labeled axes. The code loads CSV data via D3’s `d3.csv` method, slices the first twelve records, and uses `d3.scaleBand` and `d3.scaleLinear` to map states and costs to pixel positions. React manages the data state and renders the SVG elements, including bars and axis ticks, within a single D3-powered component.
AI-generated descriptionA whole smiley face
MIT Licensed



Comments
Sign in to join the discussion.