🌍 Public
Question 2
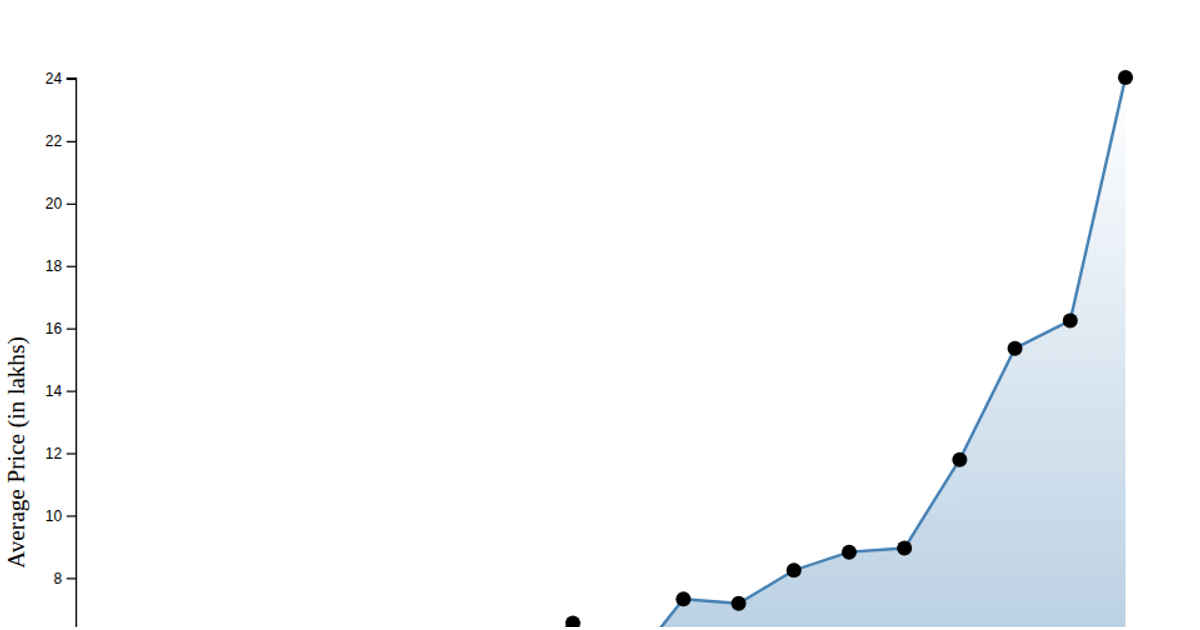
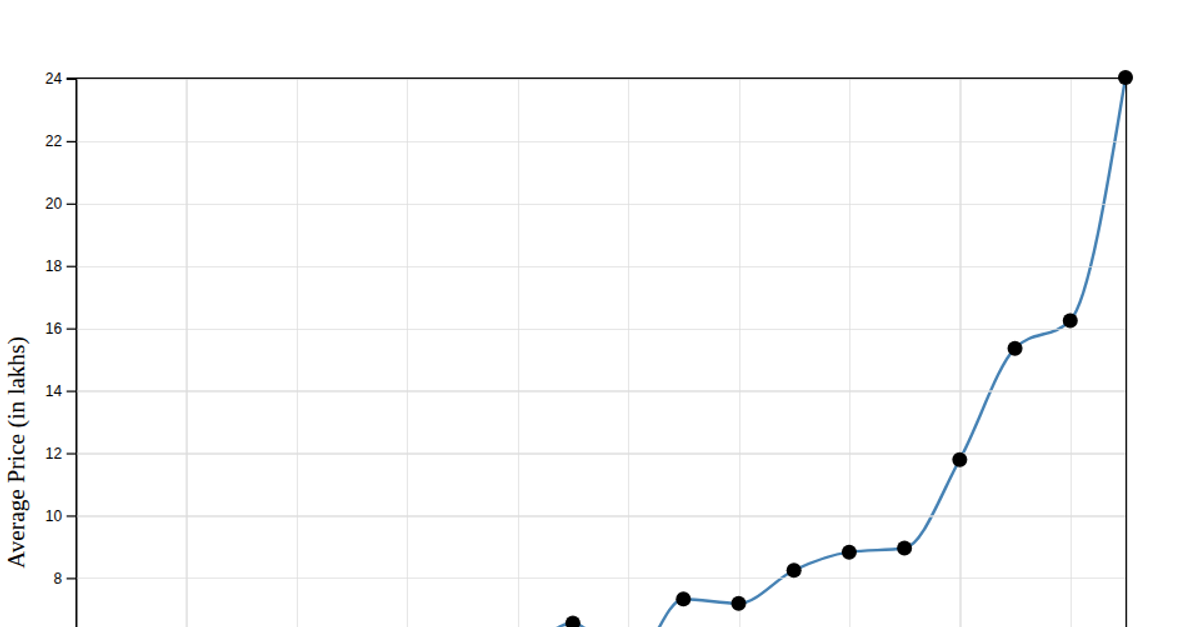
This example visualizes the average price of avocados over time, aggregating daily data into monthly averages. The chart uses an area plot with overlaid circular markers to highlight each monthly data point, rendered as SVG. The code loads data from a CSV file using `d3.csv`, aggregates it with `d3.rollups` and `d3.mean`, and scales time and price with `d3.scaleTime` and `d3.scaleLinear`. An interactive tooltip appears on hover, and axes are generated via `d3.axisBottom` and `d3.axisLeft`.
AI-generated descriptionAn example showing the capabilities of VizHub:
- Loads D3 via UNPKG.
- Demonstrates use of
importfrom"d3". - Demonstrates use of
importfrom local ES6 modules.
MIT Licensed



Comments
Sign in to join the discussion.