🌍 Public
Firefly Earthquakes
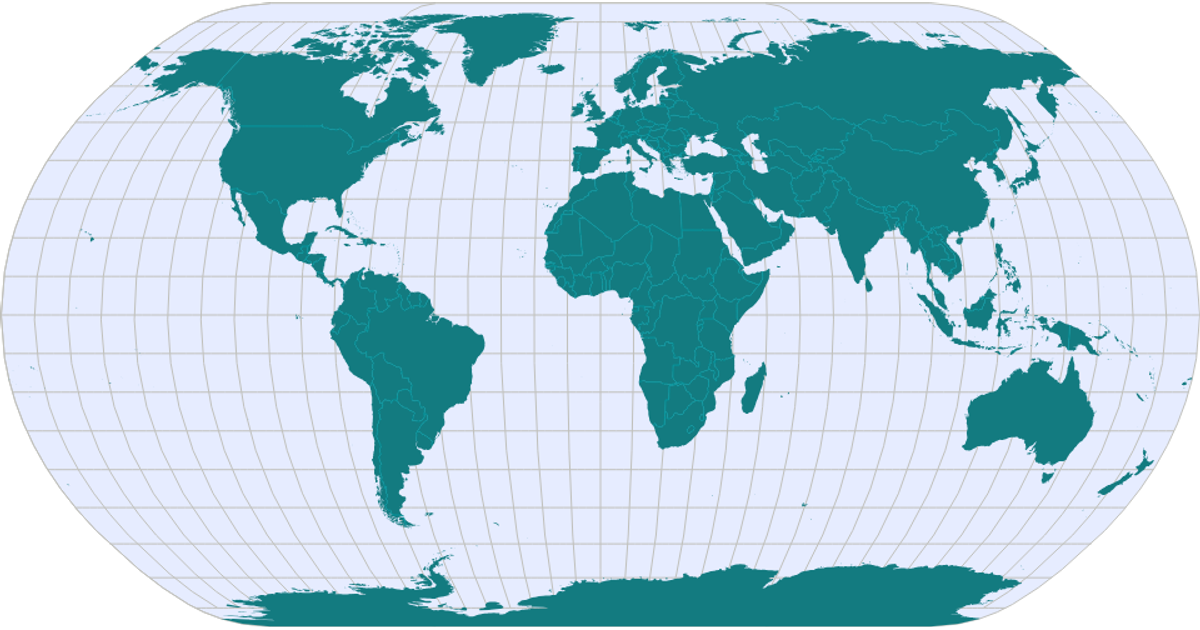
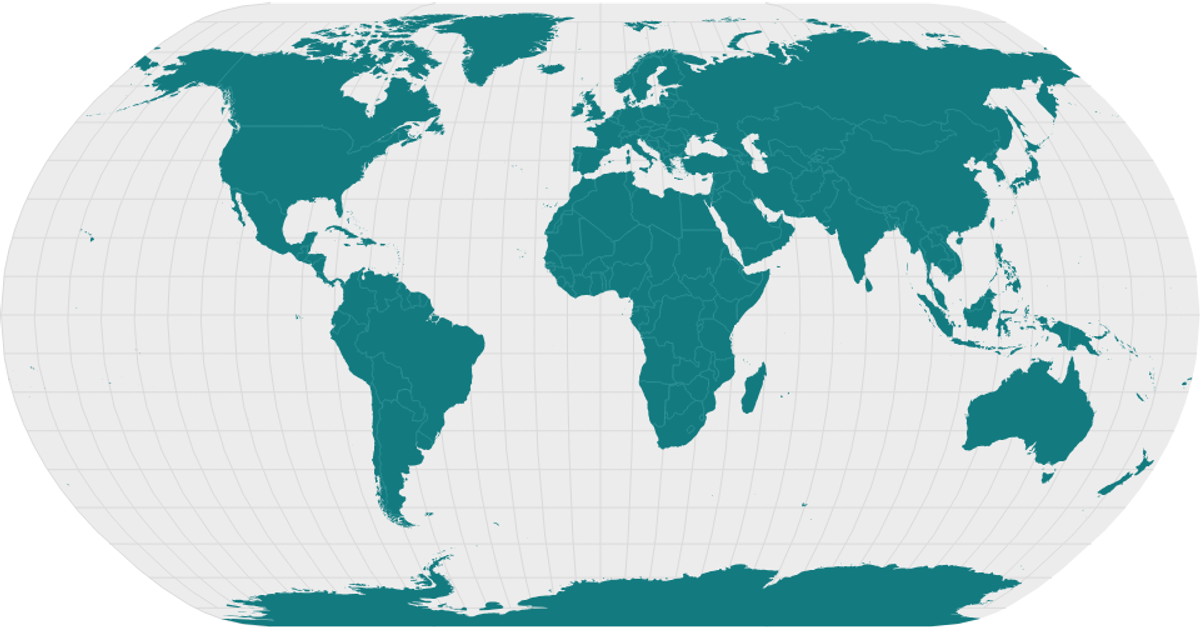
A world map rendered with a light basemap displays earthquakes as glowing teal points that flicker with a firefly-like intensity. Each point is positioned by its latitude and longitude, with the glow generated by a radial gradient sprite whose opacity follows a Gaussian distribution. The visualization uses OpenLayers for map navigation and layer management, React for the interface, and D3’s `csv` loader to fetch earthquake data from a GitHub-hosted CSV file.
AI-generated descriptionFirefly Cartography with OpenLayers and React.
Each point is an earthquake. Data from Pablo Navarro's Earthquake Map.
MIT Licensed





Comments
Sign in to join the discussion.