🌍 Public
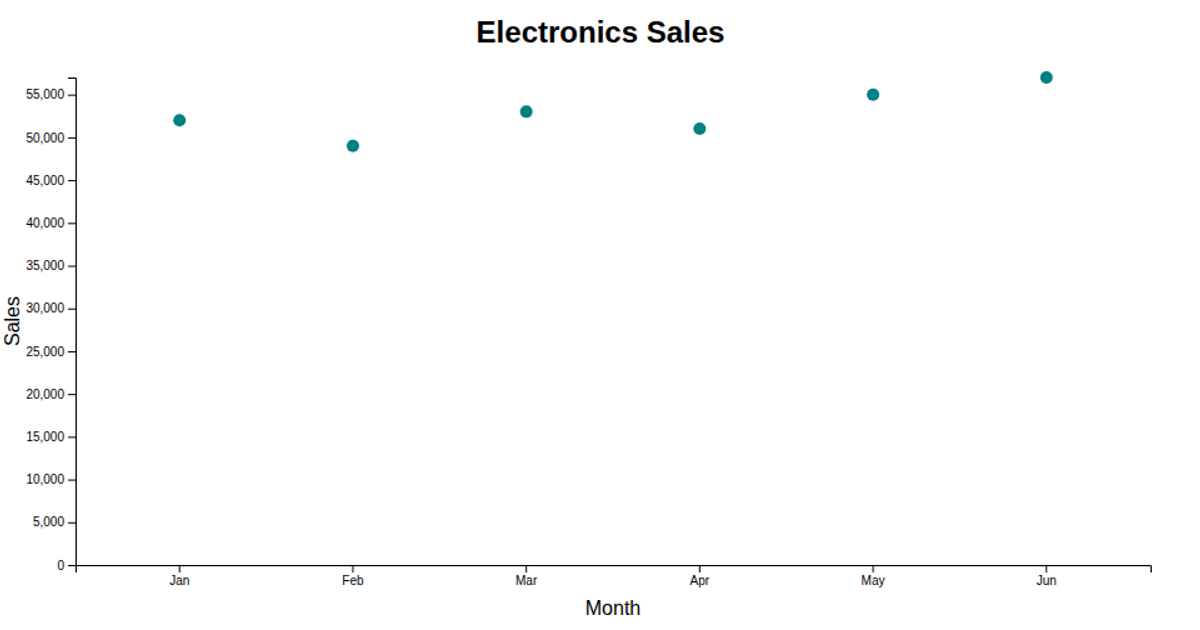
Scatter plot for Electronics sale
This scatter plot displays monthly electronics sales figures as teal circles, with months on the x-axis and sales values on the y-axis. Built with D3 v6, the reusable chart function (using a closure pattern) renders an SVG, employs `d3.scaleBand` for the categorical month axis, and `d3.scaleLinear` for the sales scale. The code defines a reusable scatter plot builder with settable width, height, data, and axis labels, though the visible example is static with six months of sales data.
AI-generated descriptionMIT Licensed





Comments
Sign in to join the discussion.