🌍 Public
Fork of D3-timeline in D3.js V3 ref from (jiahuang)
Ffilipwydra
Last edited Jun 21, 2021
Created on Jun 21, 2021
Forked from D3-timeline in D3.js V3 ref from (jiahuang)
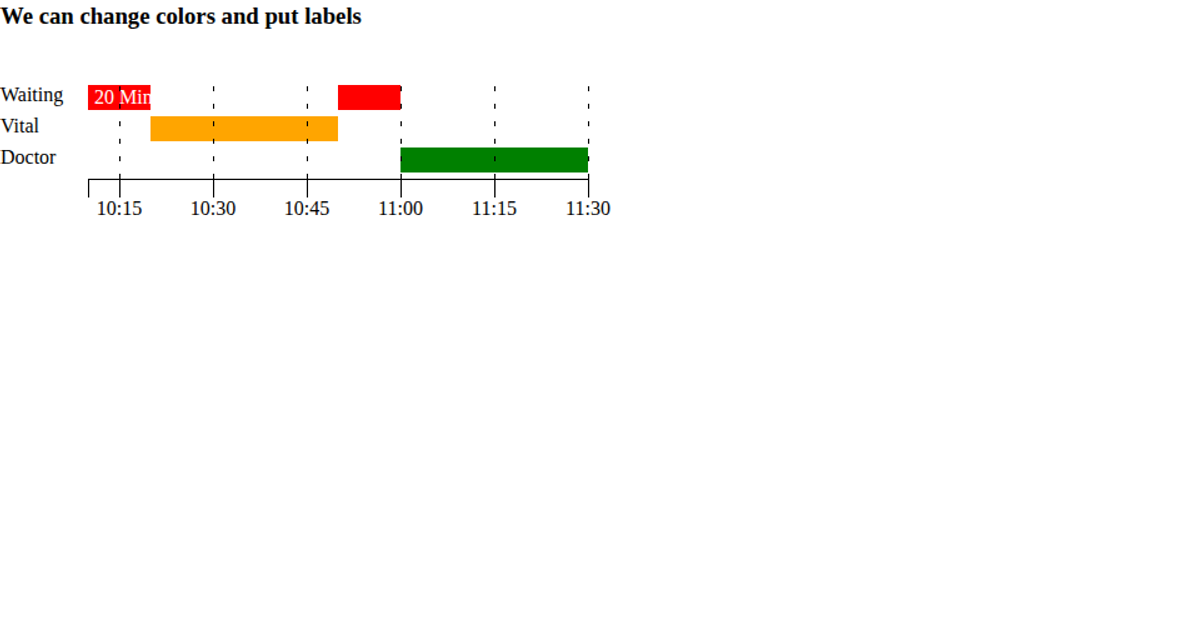
This example demonstrates a color-coded timeline visualization of patient wait times, vitals checks, and doctor visits using stacked horizontal bars. The chart renders SVG elements through D3.js v3, utilizing the `d3.timeline` plugin to map time intervals with custom colors and labels. It shows a 15-minute tick axis with formatted time labels, and includes a legend for the three activity categories. The data is hardcoded as JavaScript objects containing starting and ending times parsed with `Date.parse`.
AI-generated descriptionMIT Licensed




Comments
Sign in to join the discussion.