🌍 Public
Let's make a yunnan map with D3.js!
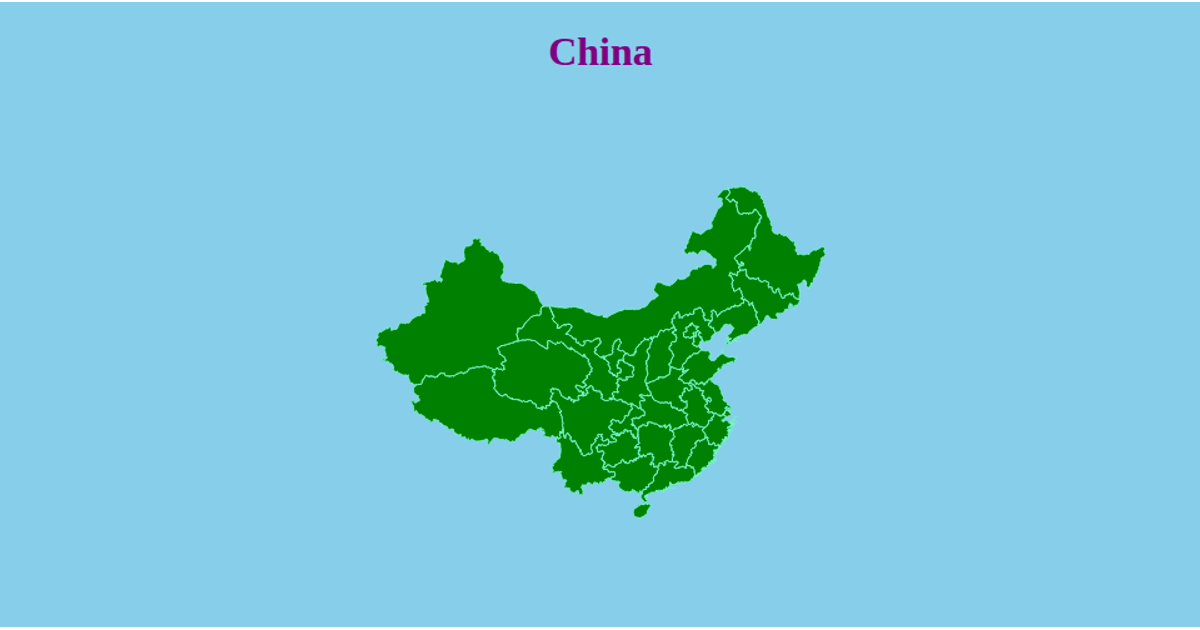
An interactive D3.js map of Yunnan Province visualizes population data across its administrative regions as semi-transparent circles sized by a square-root scale. Built with d3.geoMercator for projection and d3.geoPath for rendering GeoJSON boundaries, the map supports zooming and panning via the d3.zoom API. The choropleth uses a two-tone fill to distinguish regions with data from those without, while a legend explains the circle sizing. Population statistics are loaded from a CSV file and joined to geographic features using TopoJSON.
AI-generated descriptionMIT Licensed





Comments
Sign in to join the discussion.