🌍 Public
Untitled
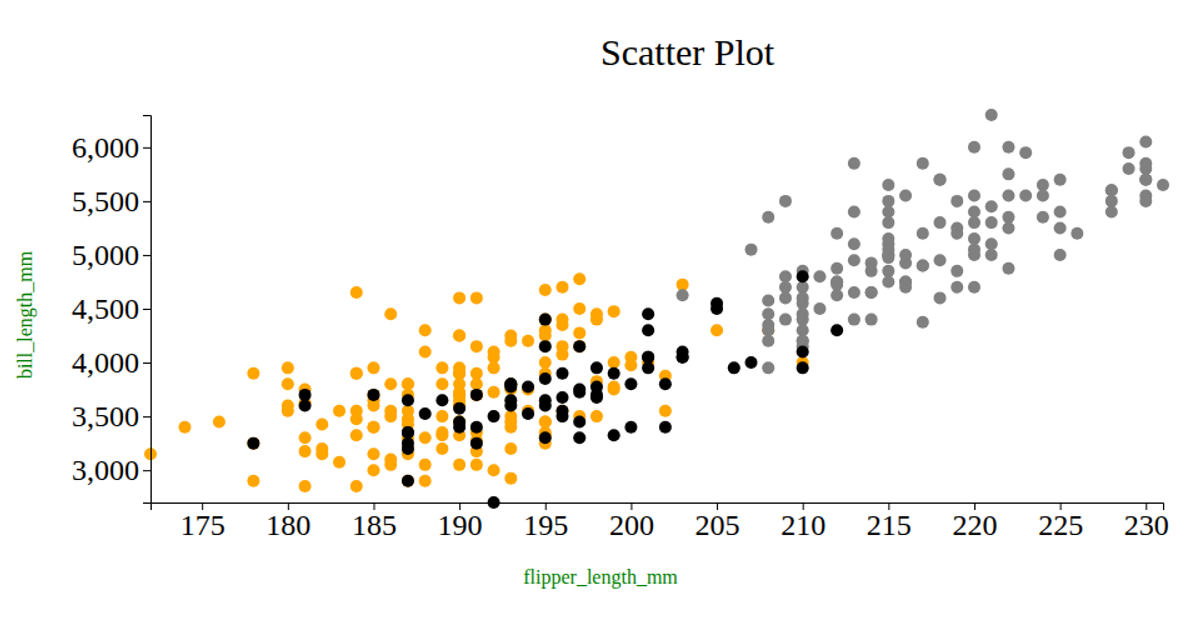
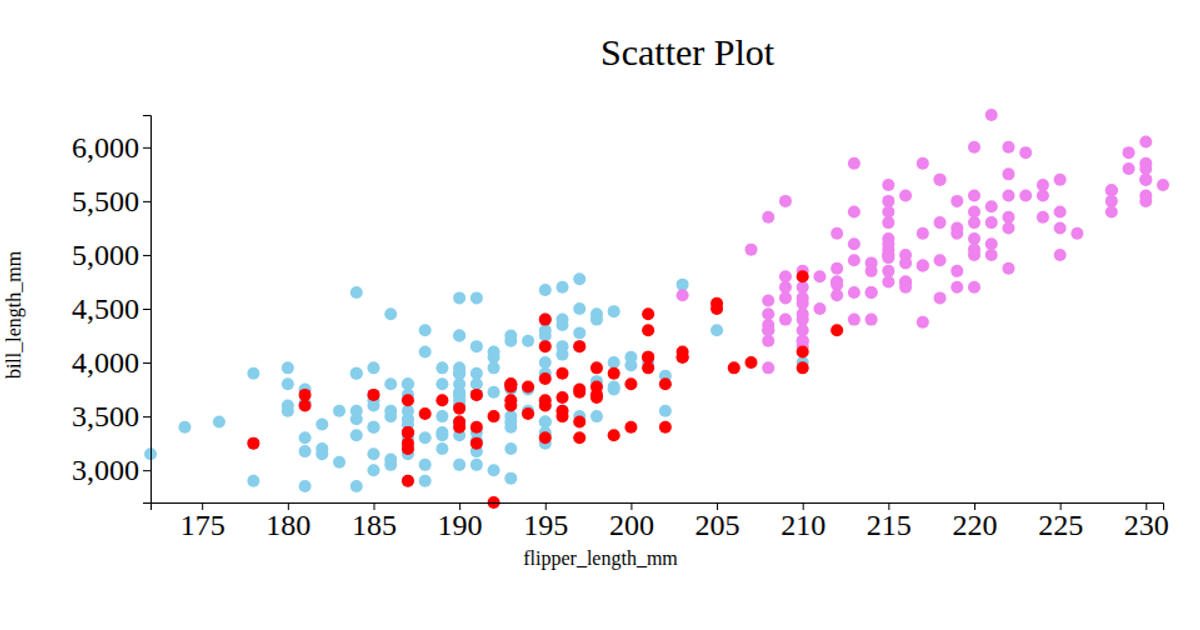
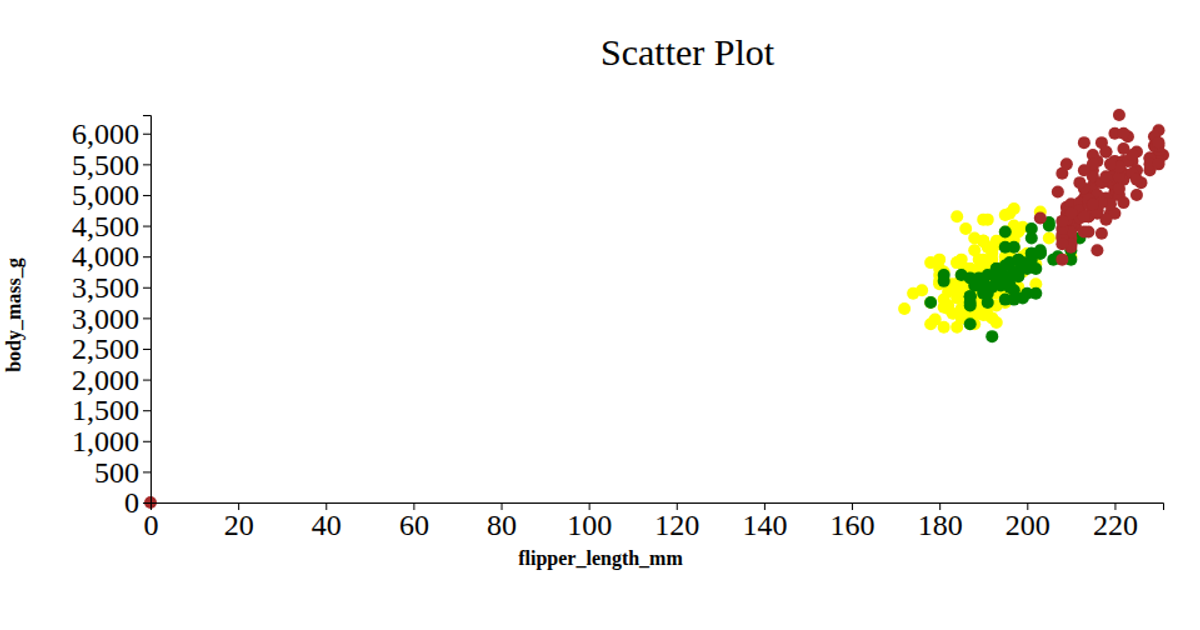
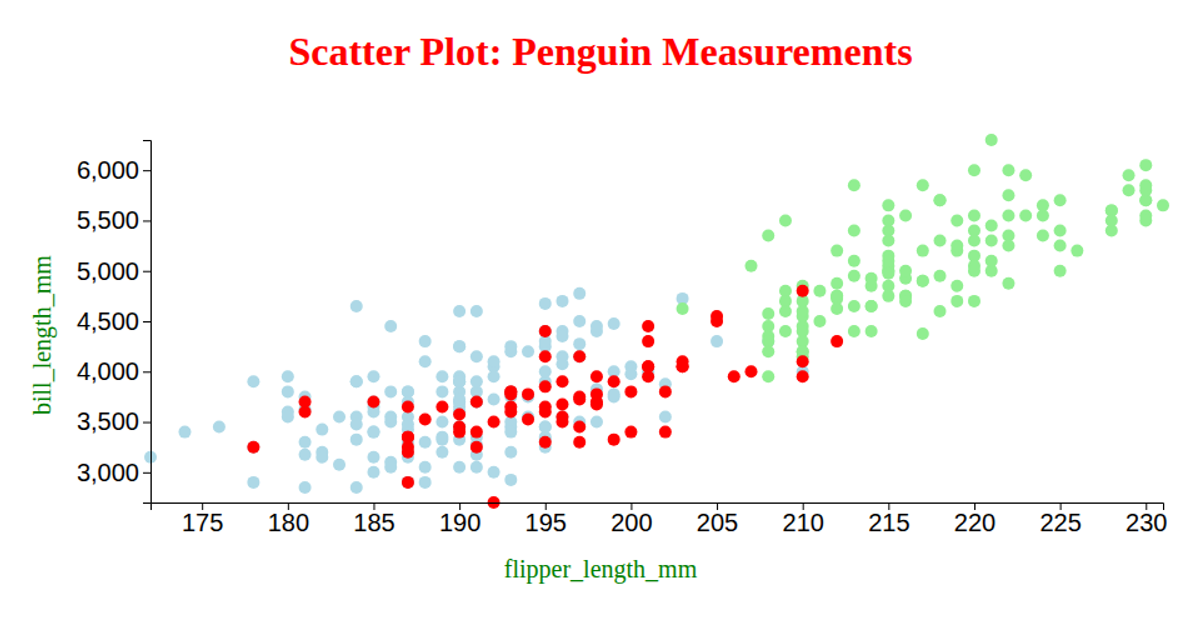
This example shows a scatter plot of penguin measurements, comparing flipper length on the x-axis against bill depth on the y-axis. Each point represents an individual penguin, colored by species (Adelie, Gentoo, Chinstrap) via a d3.scaleOrdinal mapping to red, green, and blue. The visualization loads data from a CSV file using d3.csv, applies linear scales (d3.scaleLinear) for both axes, and renders circles within an SVG element. Axis labels and rotated tick text are added using d3.axisBottom and d3.axisLeft.
AI-generated descriptionA bare minimum HTML page demonstrating use of CSS and JavaScript.
See also React Starter.
MIT Licensed




Comments
Sign in to join the discussion.