🌍 Public
Fork of Fork of Fork of Fork of ICE-6 Scatter Plot
RRakesh Kumar Chekuri
Last edited Mar 20, 2024
Created on Mar 20, 2024
Forked from Fork of Fork of Fork of ICE-6 Scatter Plot
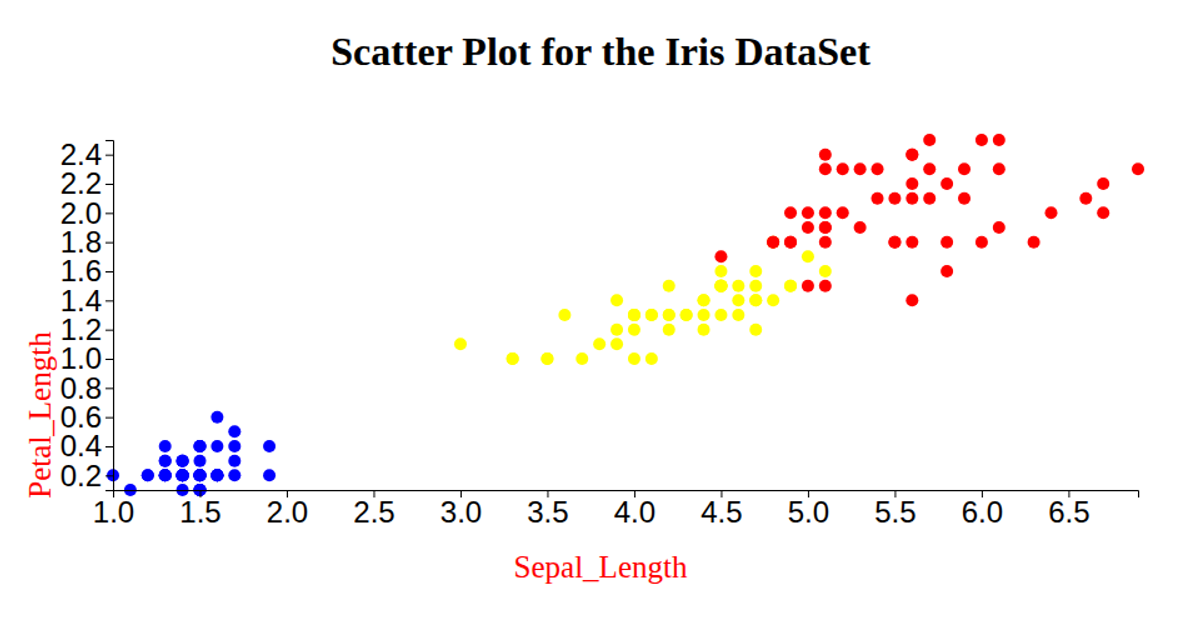
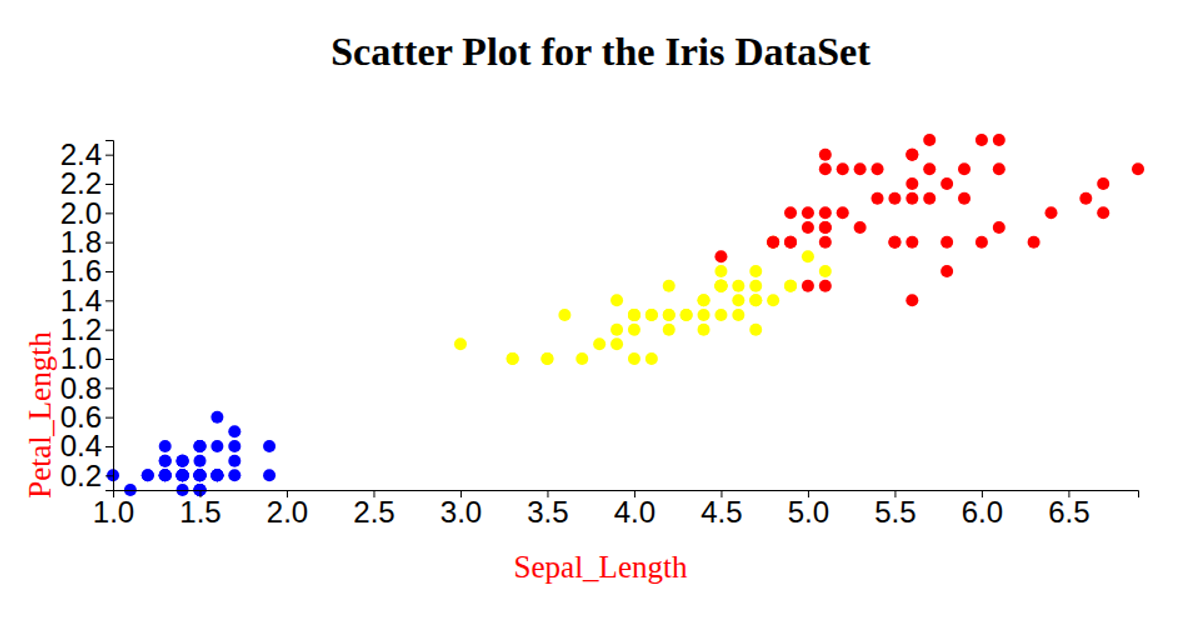
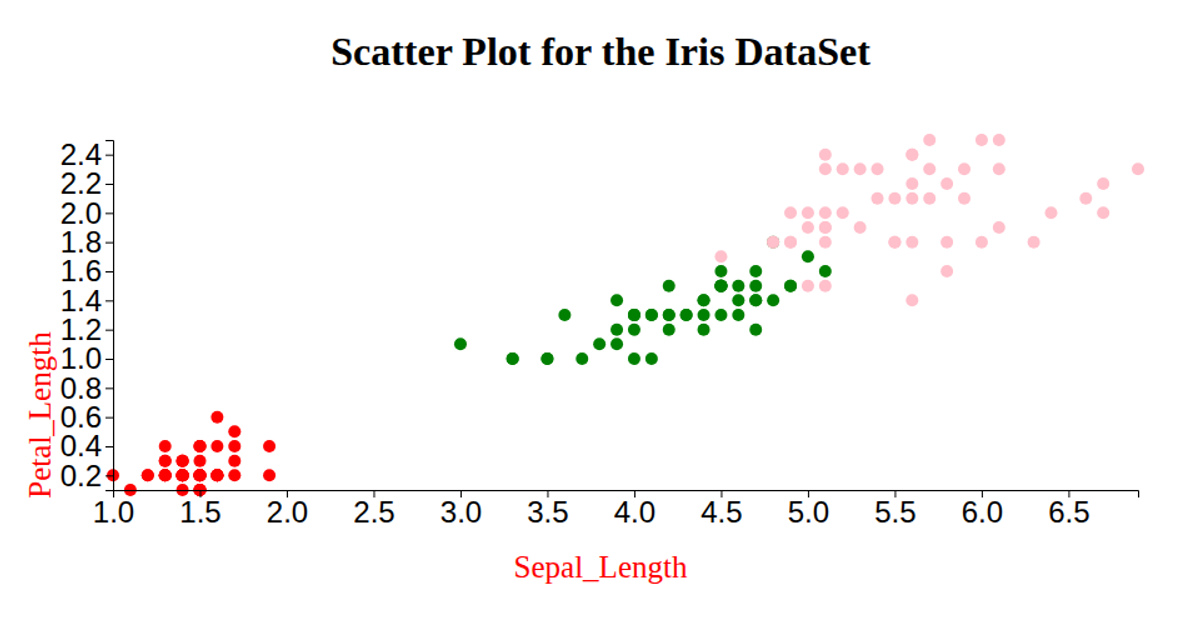
This scatter plot visualizes the Iris dataset, plotting petal length against petal width with points colored by species. The code uses D3 v6’s `csv`, `scaleLinear`, `extent`, and `axisLeft`/`axisBottom` APIs within a React-style SVG rendering. It loads data from a raw GitHub gist, parses numeric fields, and maps sepal measurements to circle properties via `rx` and `ry`. Axis labels are added using D3’s `text` elements, with custom font styling.
AI-generated descriptionA bare minimum HTML page demonstrating use of CSS and JavaScript.
See also React Starter.
MIT Licensed





Comments
Sign in to join the discussion.