🌍 Public
student_performance
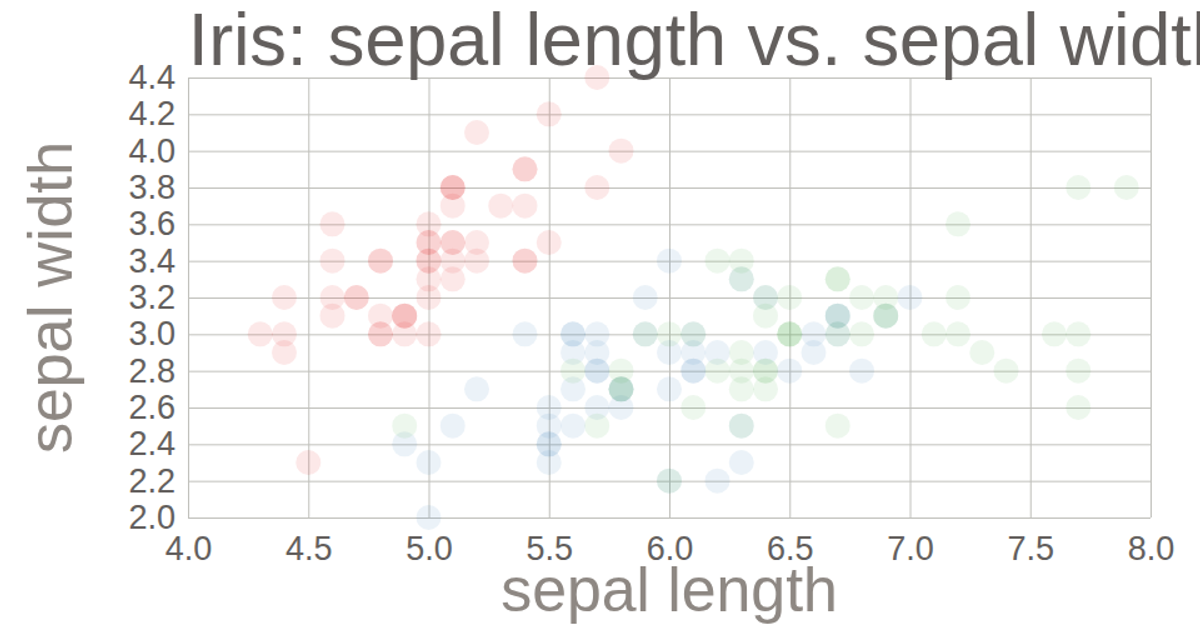
This scatter plot visualizes the Iris dataset, comparing sepal length and width across three species. The chart uses a BBC-style color theme to distinguish setosa, versicolor, and virginica points. Hovering over legend items fades non-matching data points. The visualization is rendered with D3.js, using `scaleLinear`, `scaleOrdinal`, `axisBottom`, and `axisLeft` to build the plot.
AI-generated descriptionMIT Licensed






Comments
Sign in to join the discussion.