🌍 Public
47) Log Scale
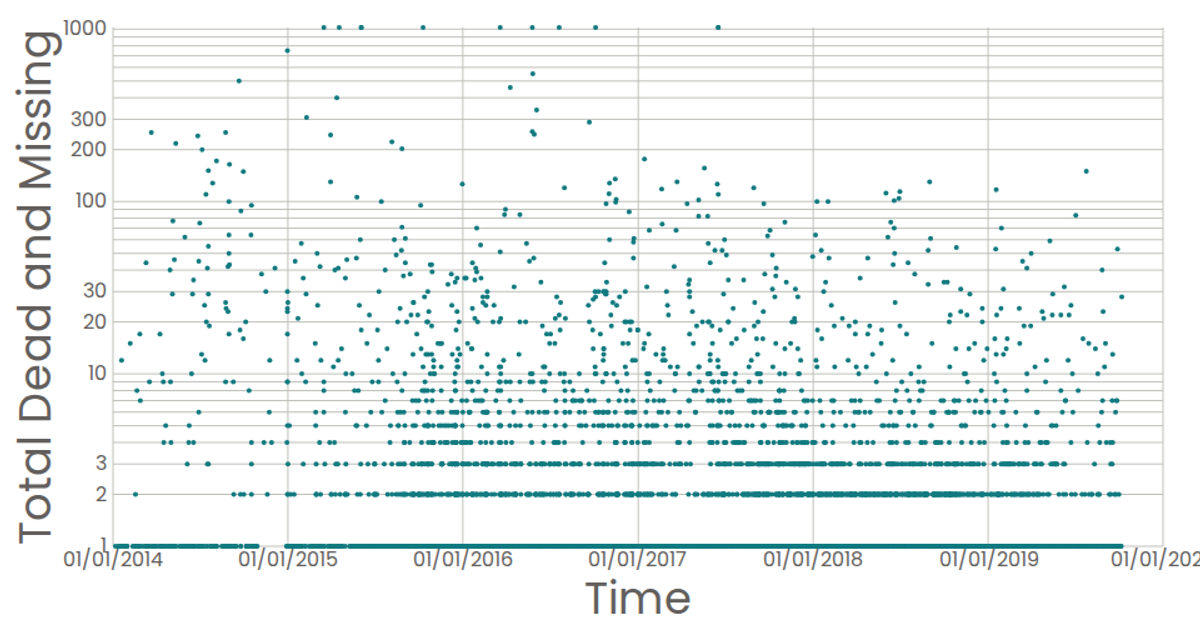
A scatterplot displays reported dates against total dead and missing migrants, using a logarithmic scale for the y-axis to accommodate a wide range of values. React components render SVG circles for each data point, with d3.scaleLog and d3.scaleTime mapping the data, while custom axes use d3’s tick formatting. The dataset comes from a CSV of Missing Migrants Global incidents, and tooltips show the reported date via SVG titles.
AI-generated descriptionStylized Line Chart Working With Time
MIT Licensed




Comments
Sign in to join the discussion.