🌍 Public
Line Chart
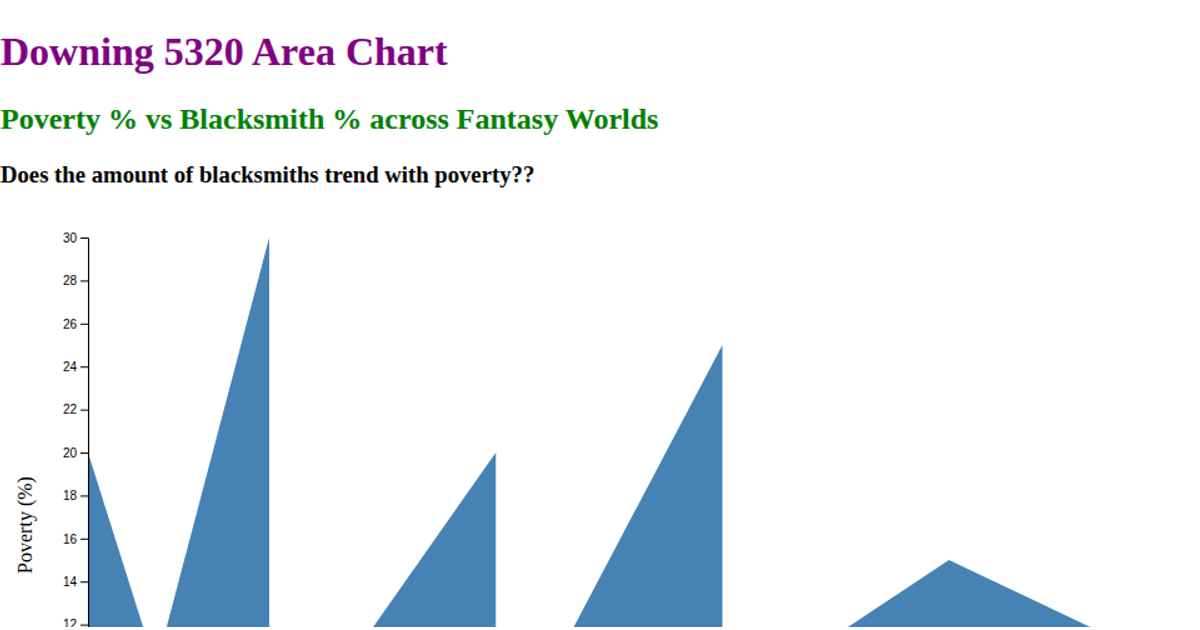
This line chart explores the relationship between poverty percentage and blacksmith percentage across fantasy worlds, using a line to connect data points sorted by blacksmith rate. The visualization shows no clear trend between the two variables. Built with React and D3 v5, the code uses `d3.csv` to load external data, `d3.scaleLinear` for axes, `d3.line` for the path generator, and `d3.axisBottom`/`d3.axisLeft` for tick marks. SVG rendering displays the steelblue line and labeled axes.
AI-generated descriptionReact Starter code.
MIT Licensed




Comments
Sign in to join the discussion.