🌍 Public
Surendra_Activity_6.12
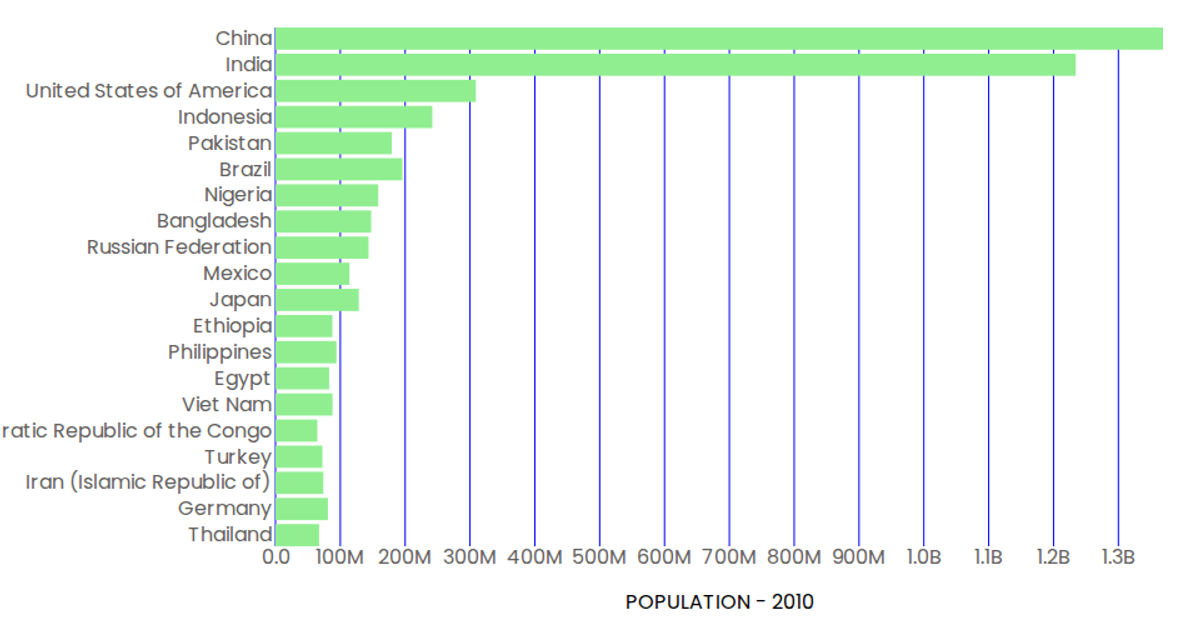
This example shows a horizontal bar chart of the 2010 population for 20 countries, using a linear scale for population values and a band scale for country names. The visualization is built with React and D3 v5, rendering SVG rectangles for each bar. The population data is loaded from a CSV via `d3.csv` and formatted with `d3.format`. Axes are custom components that use `scaleLinear` and `scaleBand`, with tooltips provided by SVG `<title>` elements.
AI-generated descriptionA demonstration of how to start using D3 version 6.
MIT Licensed





Comments
Sign in to join the discussion.