🌍 Public
Vega-Lite Iterations
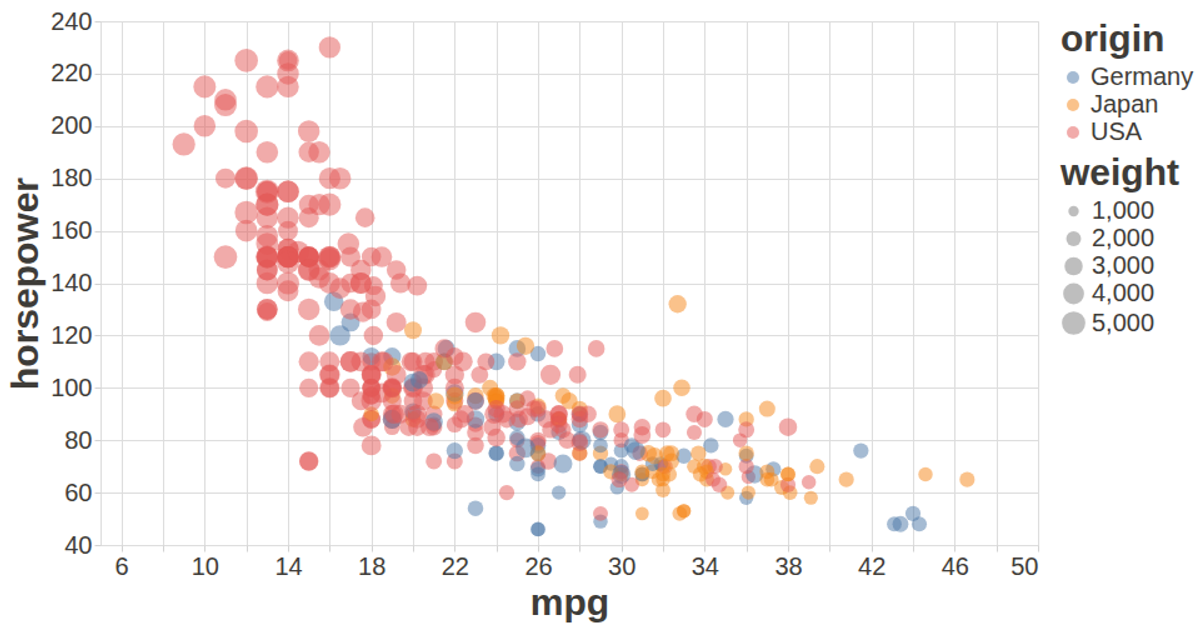
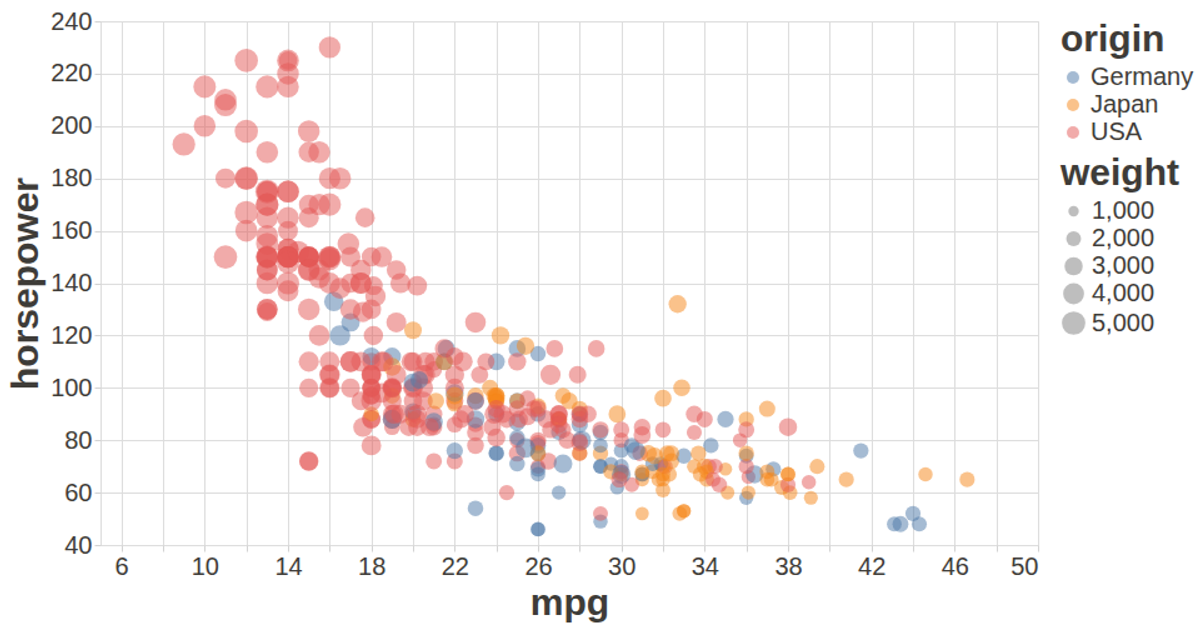
This example demonstrates an interactive scatter plot of automotive fuel economy data, showing the relationship between cylinder count and origin while revealing individual car names through tooltips. Rendered as a Vega-Lite visualization via the `vega-lite-api`, the chart applies a custom configuration for axis styling and font sizes before resizing to fit the viewport. The data is loaded asynchronously from a CSV using `d3.csv`. The plot uses semi-transparent, oversized marks with opacity encoding to avoid overplotting, and the code registers `vega-tooltip` for hover interactions.
AI-generated descriptionA visualization constructed using the vega-lite-api.
MIT Licensed



Comments
Sign in to join the discussion.