🌍 Public
BonusICE_SBA
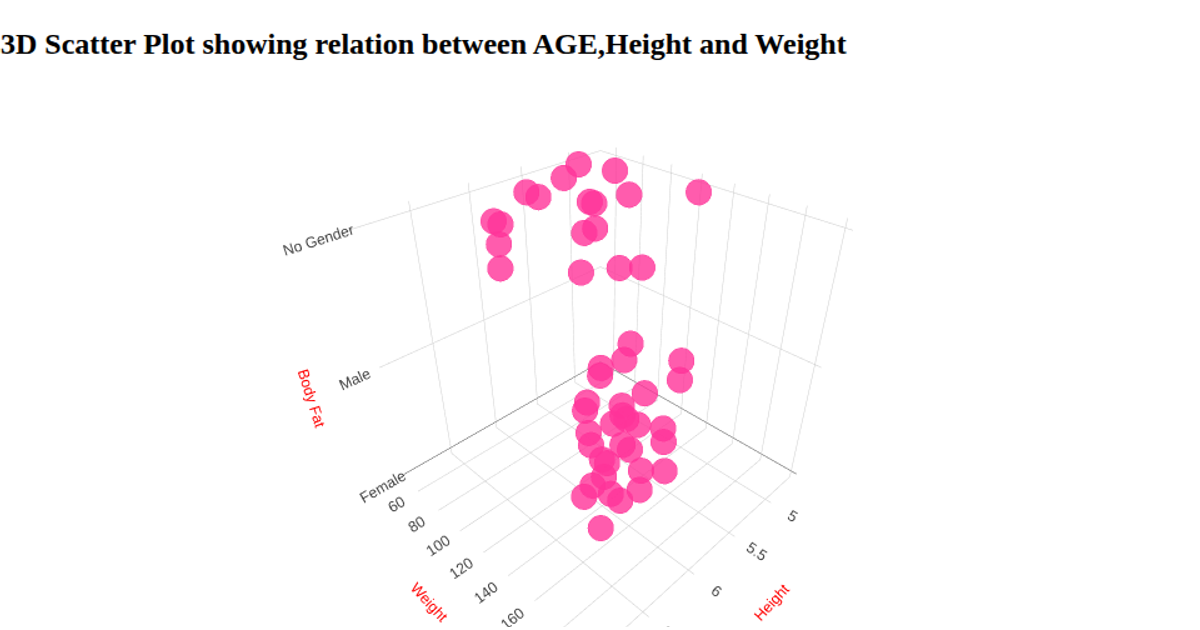
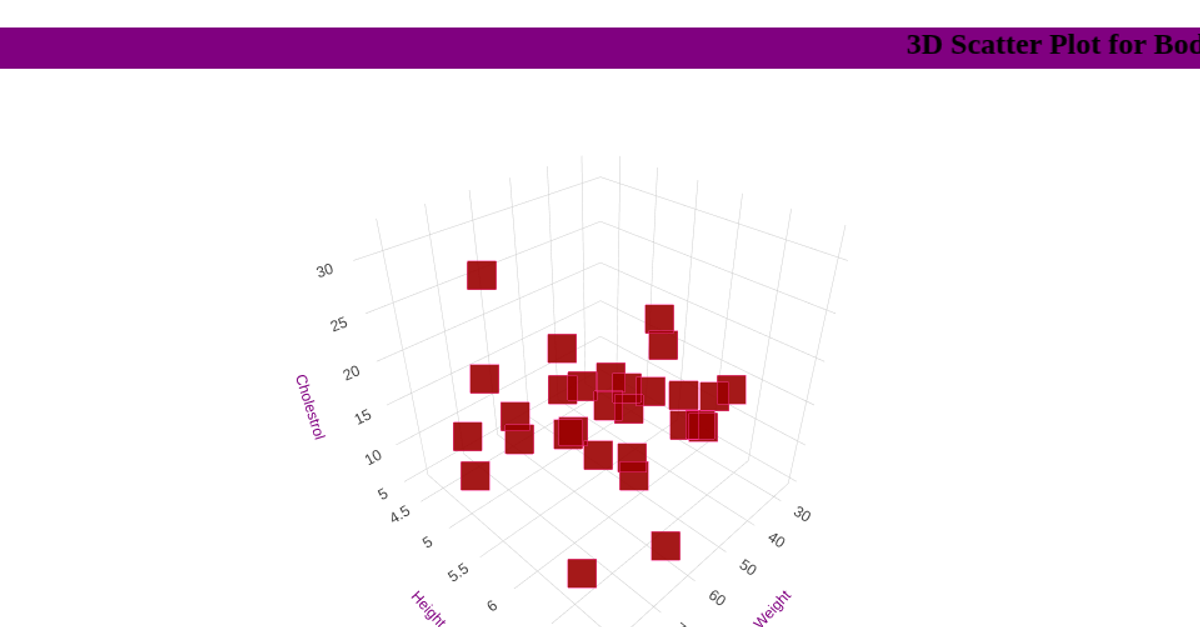
This example shows a 3D scatter plot of body mass index data, plotting Height, Weight, and Body Fat percentage as x, y, and z coordinates, with each marker rendered as a pink cross. It uses Plotly’s `scatter3d` trace type via `Plotly.newPlot` to render the interactive chart inside a `div`. The data is loaded from a CSV file using D3’s `d3.csv` and parsed with a custom `unpack` function to extract attribute columns. Axis titles are styled with custom fonts and colors, and the layout includes minimal margins.
AI-generated descriptionA bare minimum HTML page demonstrating use of CSS and JavaScript.
See also React Starter.
MIT Licensed




Comments
Sign in to join the discussion.