🌍 Public
collapisible
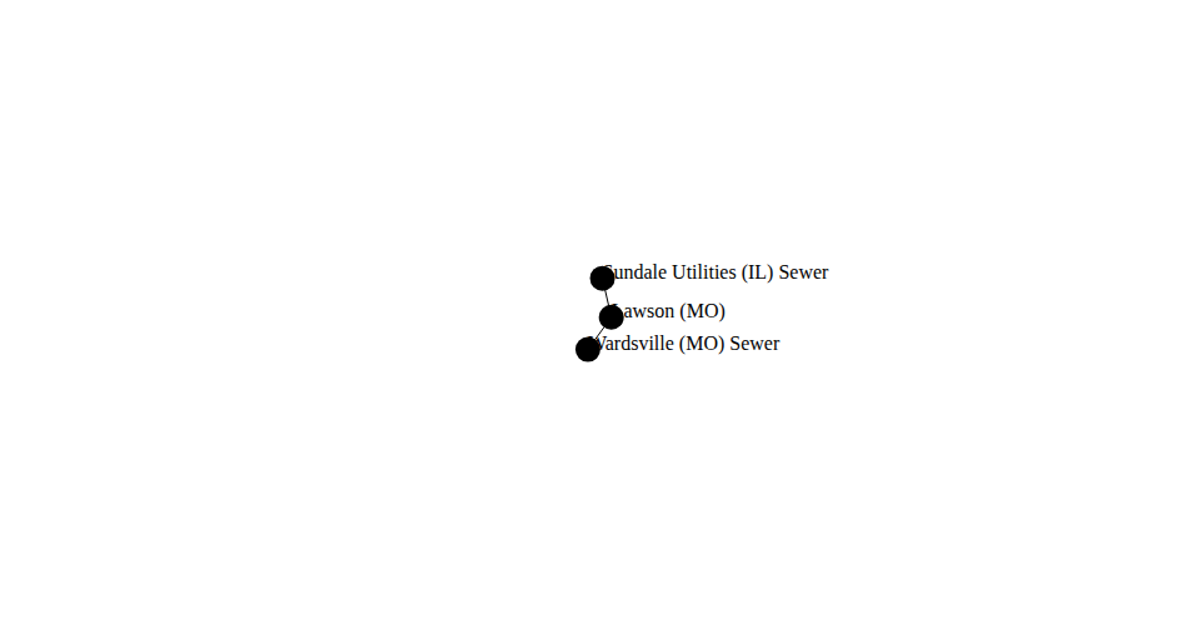
A force-directed network diagram shows nodes as circles connected by links, with a simulation that continuously adjusts their positions. The visualization uses d3.forceSimulation with forceManyBody, forceLink, and forceCenter forces to compute layout dynamics, while d3.select appends SVG circles and lines for rendering. Data comes from a local `data.json` file containing a hierarchical structure with an "SOL" root node, though the example only visualizes the flattened nodes and links arrays. The simulation updates node coordinates on each tick, repositioning the SVG elements accordingly.
AI-generated descriptionMIT Licensed






Comments
Sign in to join the discussion.