🌍 Public
task 4
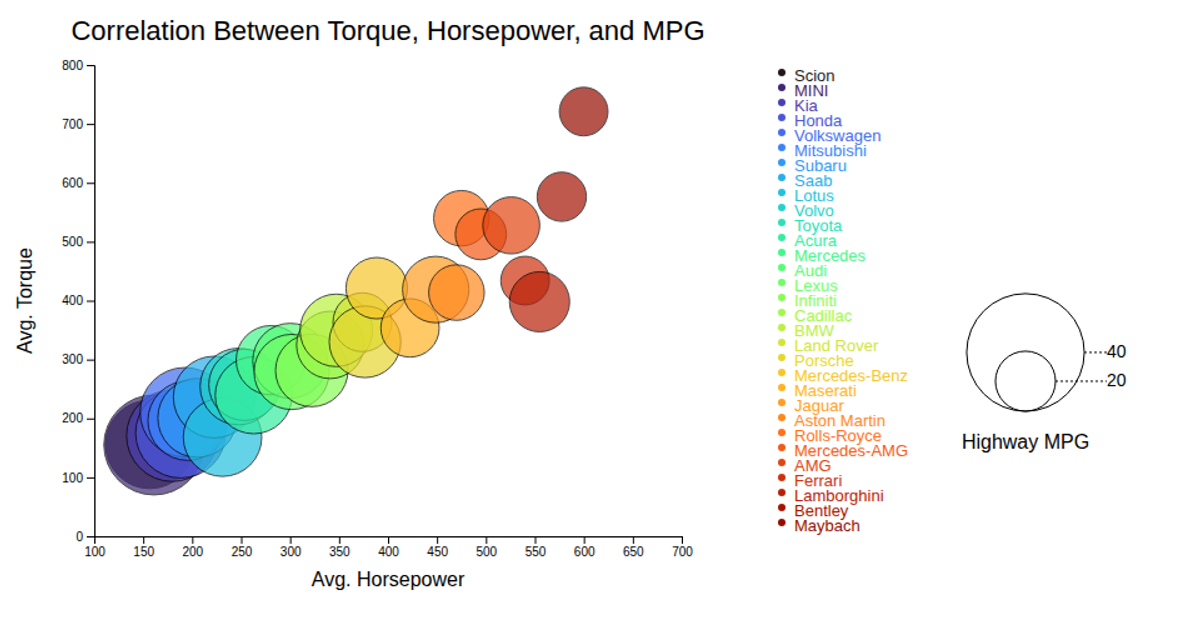
This interactive bubble chart visualizes the correlation between average horsepower, torque, and highway MPG for various motorcycle makes. Each bubble’s position is determined by its horsepower and torque values, while its size and color encode highway MPG and the manufacturer, respectively. Tooltips reveal the make on hover. Built with D3.js v7, the visualization uses ordinal color scaling with an interpolated Turbo palette and linear scales for axes and bubble radius. A legend encodes bubble size for MPG values and color for categorical makes, with SVG rendering and CSS-based hover effects for enhanced interactivity.
AI-generated descriptionMIT Licensed




Comments
Sign in to join the discussion.