🌍 Public
Question 1: Bar Chart
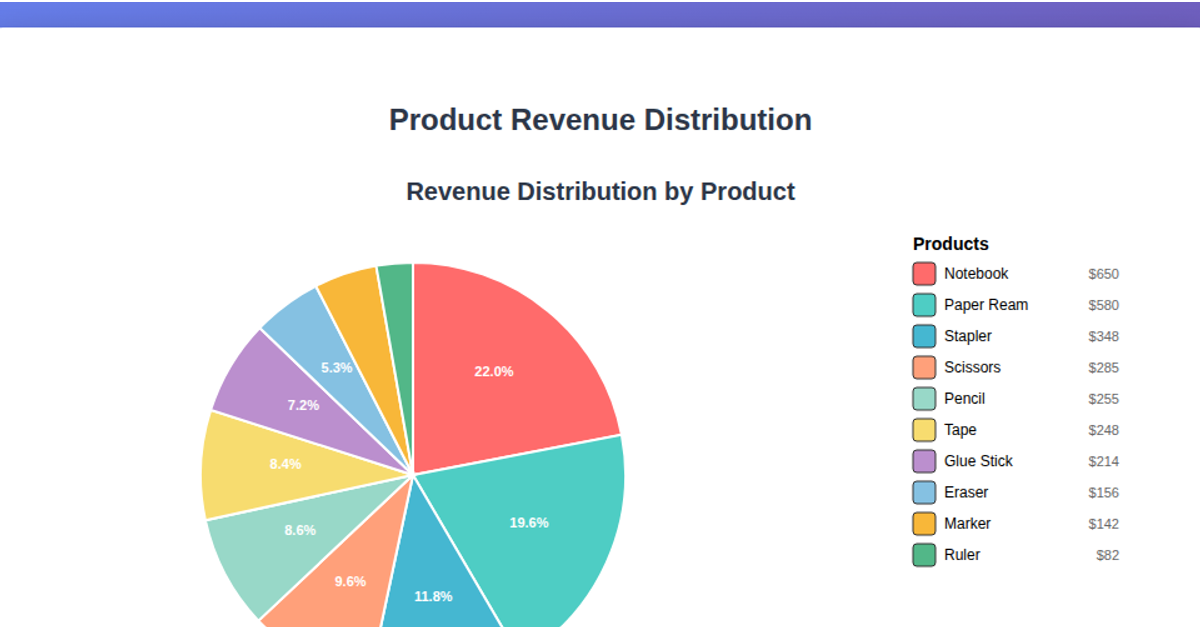
This bar chart visualizes total revenue aggregated by product from a CSV sales dataset fetched from a GitHub gist. Using D3 v7, it loads and processes the data with `d3.csv`, then applies `scaleBand` for the categorical x-axis and `scaleLinear` for the revenue y-axis. The SVG rendering includes value labels on each bar, rotated axis text, and a hover opacity transition. The bar chart displays a vertical layout with dollar amounts labeled, all within a styled container on a gradient background.
AI-generated descriptionMIT Licensed


Comments
Sign in to join the discussion.