🌍 Public
Stacked Bars and Line Chart
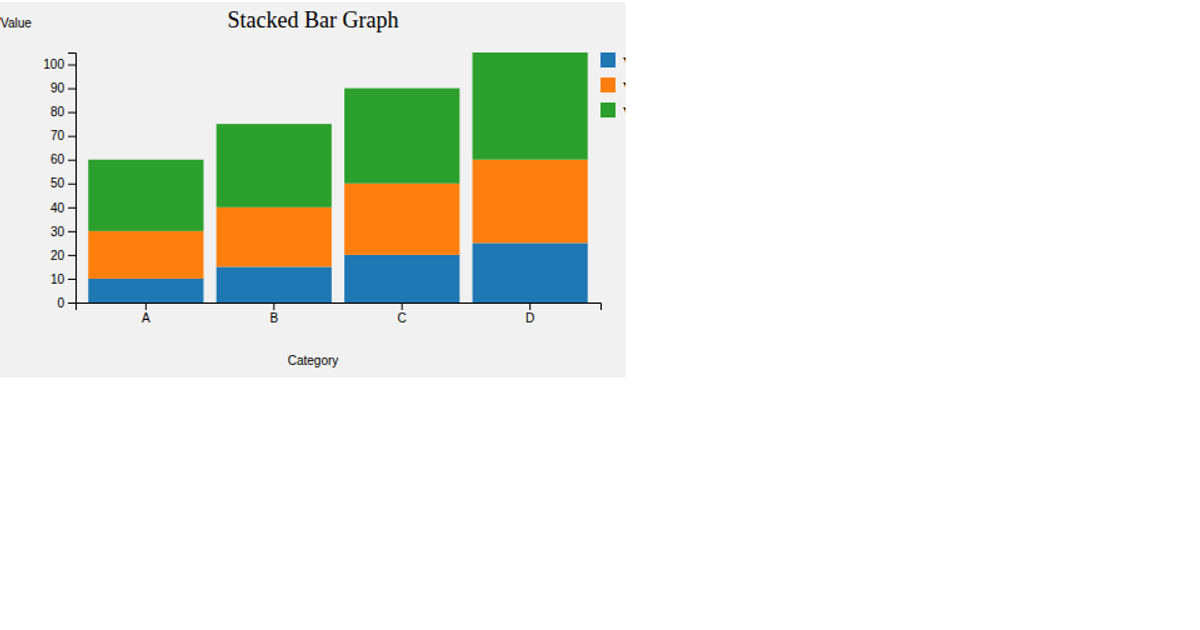
This stacked bar and line chart visualizes average balance and duration across different poutcome categories, combining two metrics into a single composition. It loads CSV data via the Fetch API and uses d3.nest with rollup to compute group means. The visualization renders SVG shapes using d3.scaleBand, d3.scaleLinear, and d3.scaleOrdinal, with d3-tip providing interactive mouseover tooltips that display precise values.
AI-generated descriptionAn example showing the capabilities of VizHub:
- Loads D3 via UNPKG.
- Demonstrates use of
importfrom"d3". - Demonstrates use of
importfrom local ES6 modules.
MIT Licensed


Comments
Sign in to join the discussion.