🌍 Public
Miles per Gallon vs Horsepower
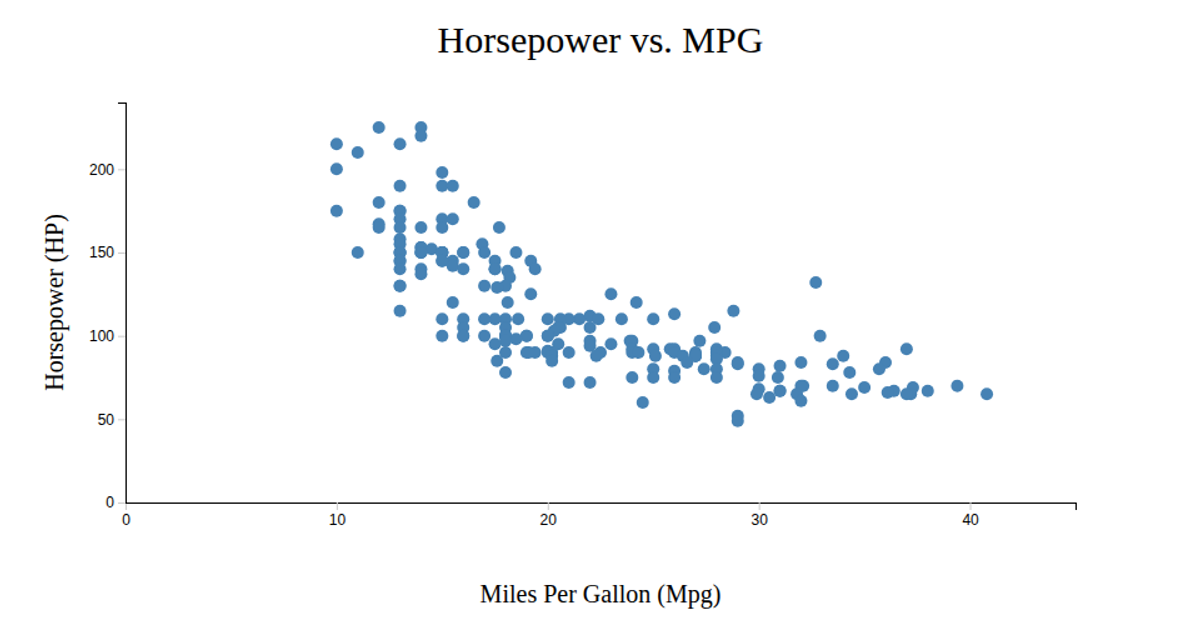
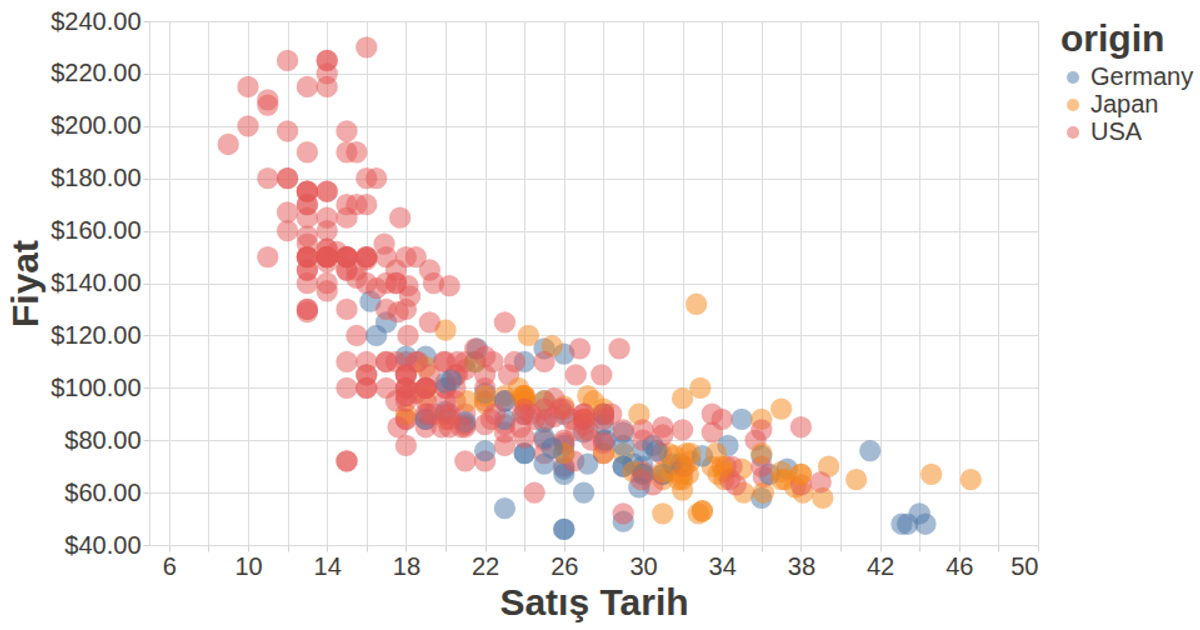
This scatter plot visualizes the relationship between miles per gallon and horsepower for 32 car models, revealing a clear negative correlation. The visualization uses D3.js v7 with SVG rendering, scaling data from the mtcars dataset via a CSV file. The code employs `d3.csv` for data loading, `scaleLinear` for both axes, and `axisLeft` and `axisBottom` for ticks. Circles are positioned using the computed scales, with axis labels added to clarify the quantitative values shown.
AI-generated descriptionScatter plot
MIT Licensed


Comments
Sign in to join the discussion.