🌍 Public
Tree Playground
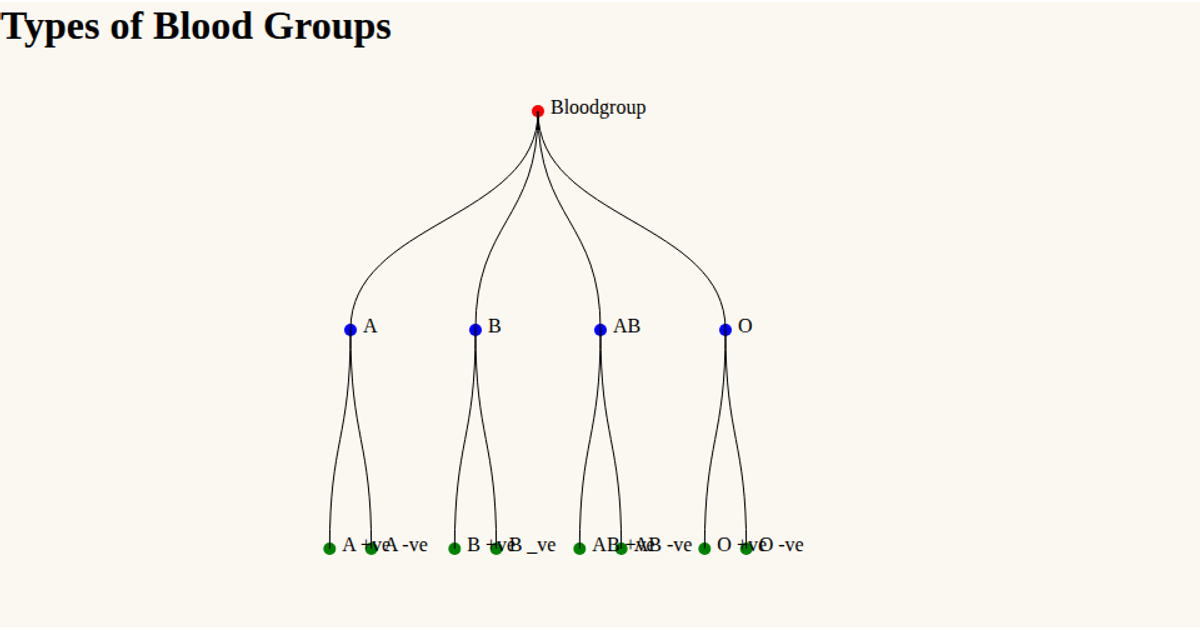
This tree diagram displays the relationships between blood types and their Rh-positive and Rh-negative subgroups. The visualization uses D3.js v6 with `d3.stratify()` to convert the flat dataset into a hierarchy and `d3.tree()` to compute node positions. Circles represent each blood group, with a color-coded generation scheme using `d3.selectAll().transition()` to animate the connections and node appearance. The SVG elements, including `path` links and `circle` nodes, are rendered with D3 data joins, and text labels identify each group.
AI-generated descriptionMIT Licensed





Comments
Sign in to join the discussion.