🌍 Public
ICE 8 - Country Map-Amarnath
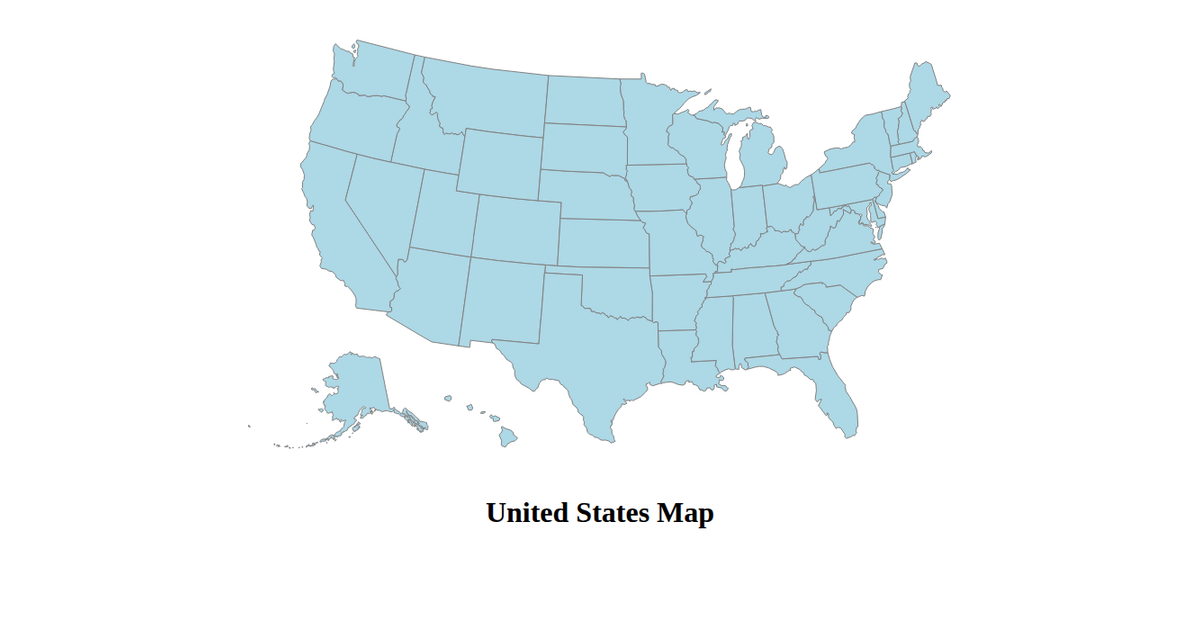
This example displays a map of the United States rendered as yellow SVG paths on a black background. It uses d3.geoPath with a d3.geoAlbersUsa projection to draw the nation’s outline from TopoJSON data loaded via d3.json from the us-atlas package. The code sets a custom margin, height, and width, and applies stroke and fill styling to the generated paths. The visualization demonstrates a minimal React-free setup using only D3 v4 and topojson-client.
AI-generated descriptionA bare minimum HTML page demonstrating use of CSS and JavaScript.
See also React Starter.
MIT Licensed




Comments
Sign in to join the discussion.