🌍 Public
Fork of Stylized Bar Chart
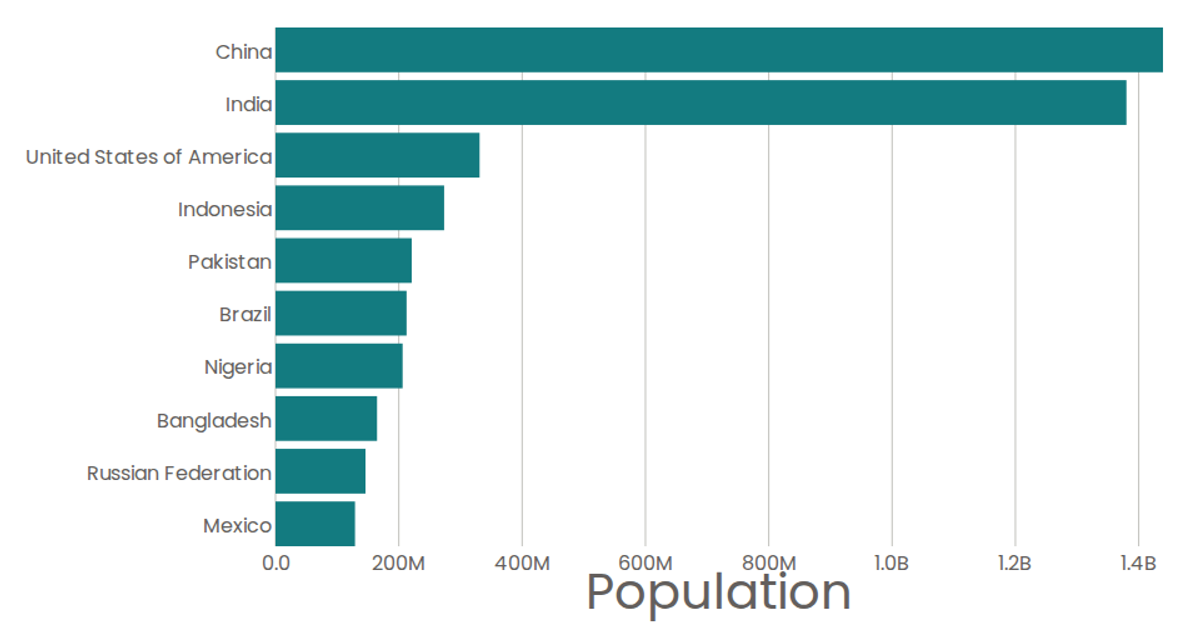
This visualization displays the top 10 most populous countries from the United Nations World Population Prospects 2019 dataset as a horizontal bar chart. The bars are rounded with simple hover tooltips showing formatted population values. Built with React and D3 v5, the chart uses `d3.scaleBand` for the categorical y-axis and `d3.scaleLinear` for the numeric x-axis, with axes rendered as SVG groups containing tick lines and labels. A custom formatting function converts raw numbers to compact notation with "B" for billions.
AI-generated descriptionA program that shows the top 10 most populous countries as a bar chart.
MIT Licensed


Comments
Sign in to join the discussion.