🌍 Public
Menus with React
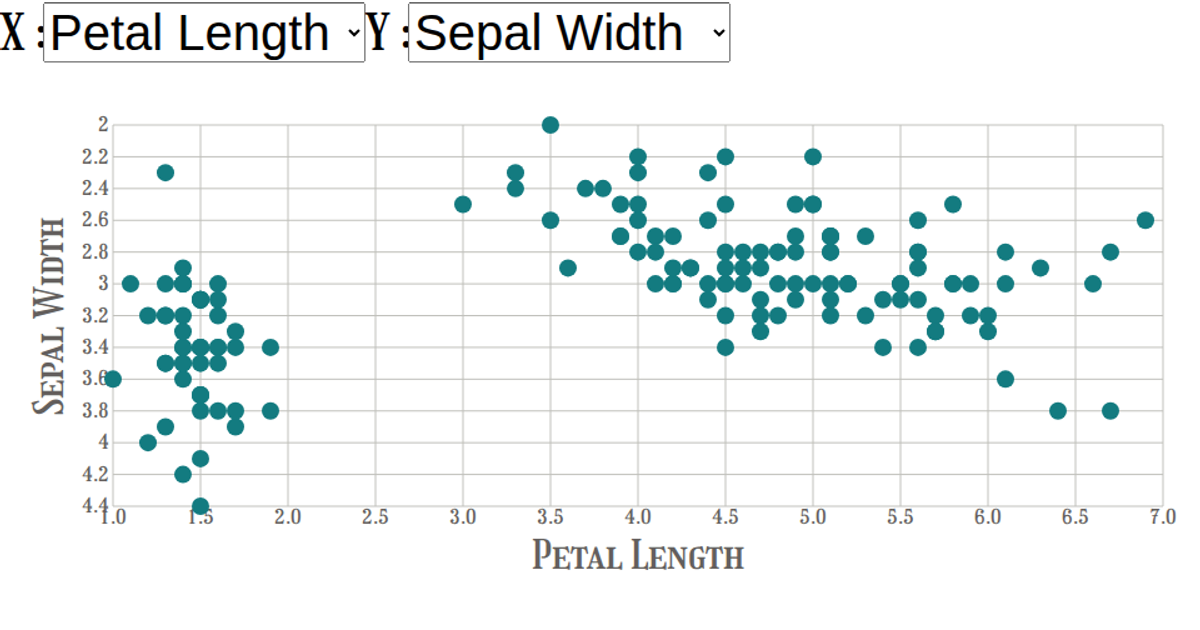
This example shows an interactive scatter plot of the Iris Dataset, allowing users to select which attributes to display on the x and y axes via dropdown menus. Hovering over a species in the color legend highlights the corresponding data points while fading others. The visualization is built using React components for the UI and SVG rendering, with D3.js v5 handling scales, axes, and color mapping. The `csv` function from D3 loads the dataset, while `scaleLinear` and `scaleOrdinal` manage the visual encoding.
AI-generated descriptionA scatter plot of The Iris Dataset.
MIT Licensed



Comments
Sign in to join the discussion.